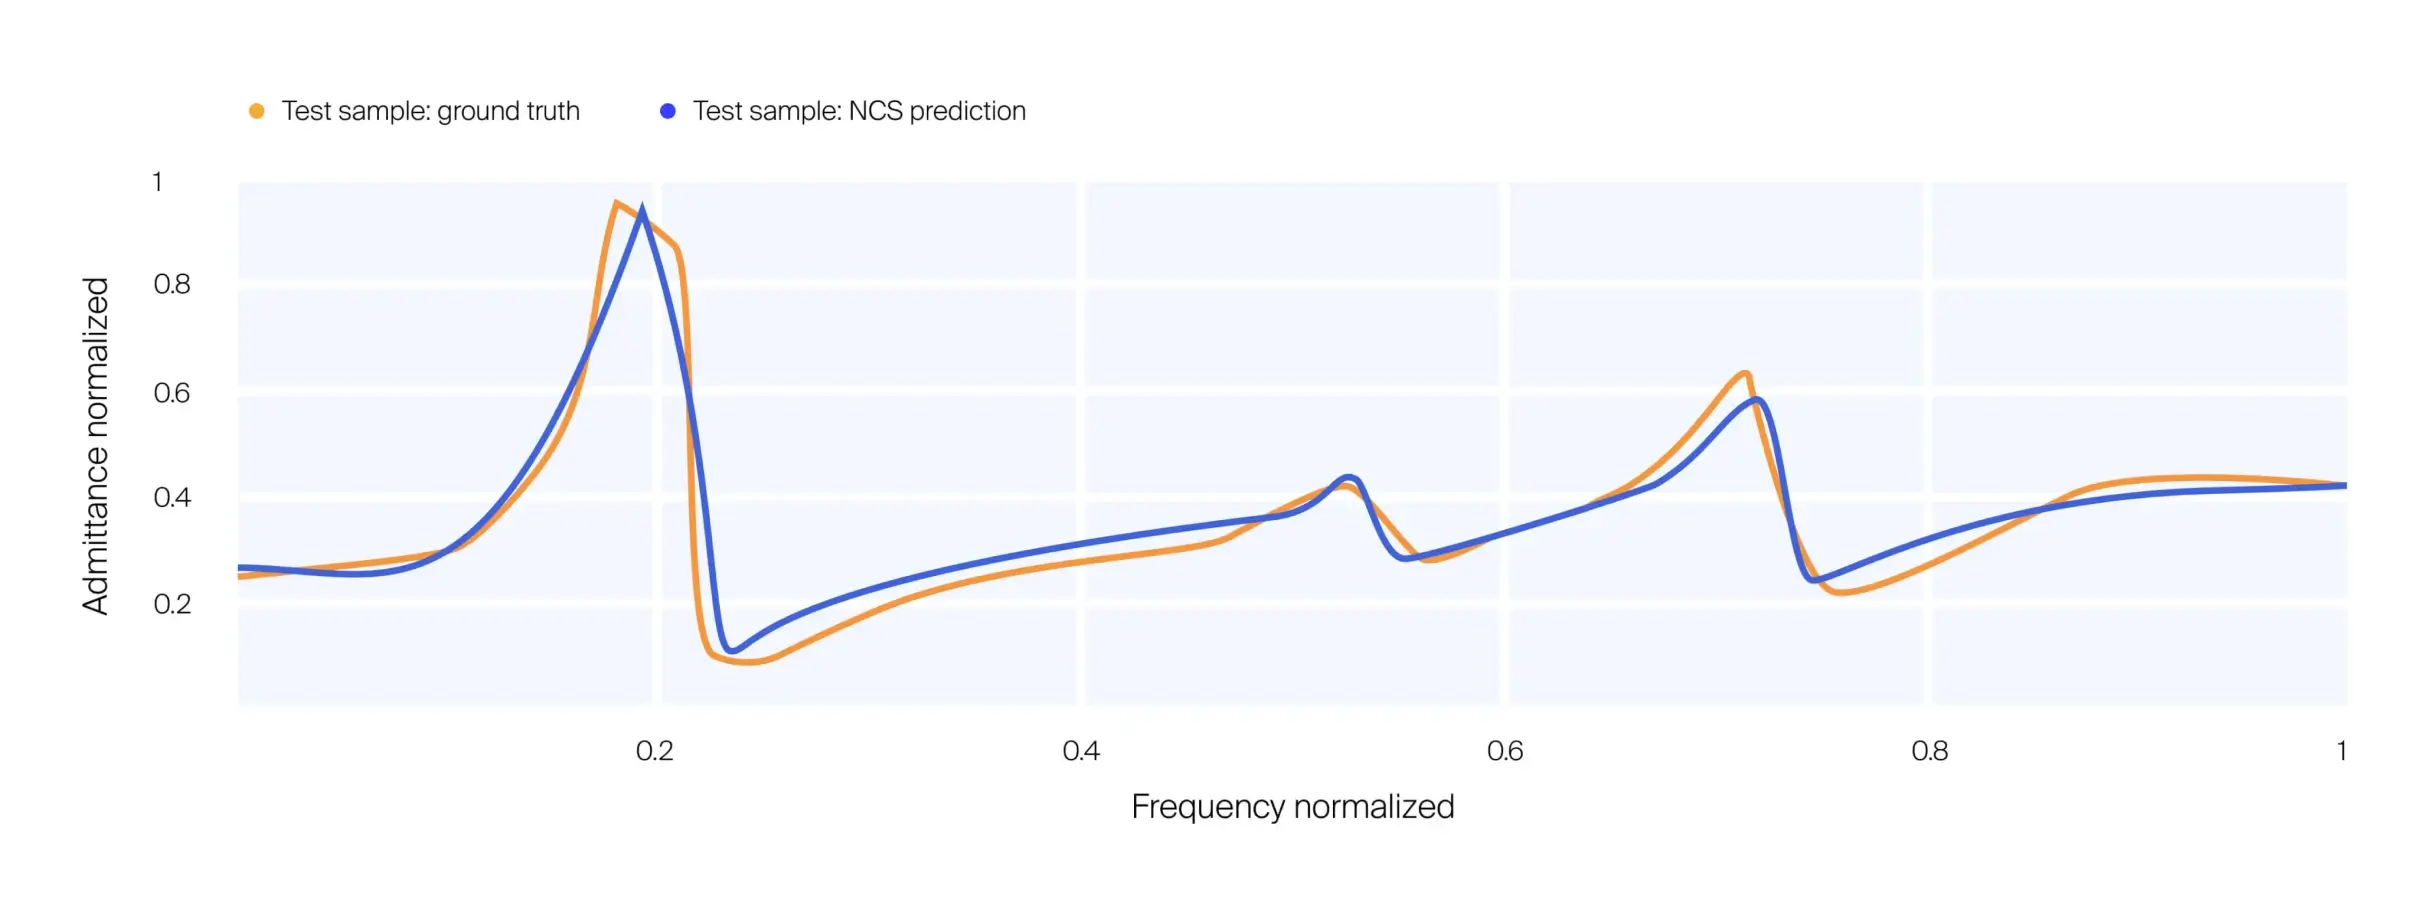
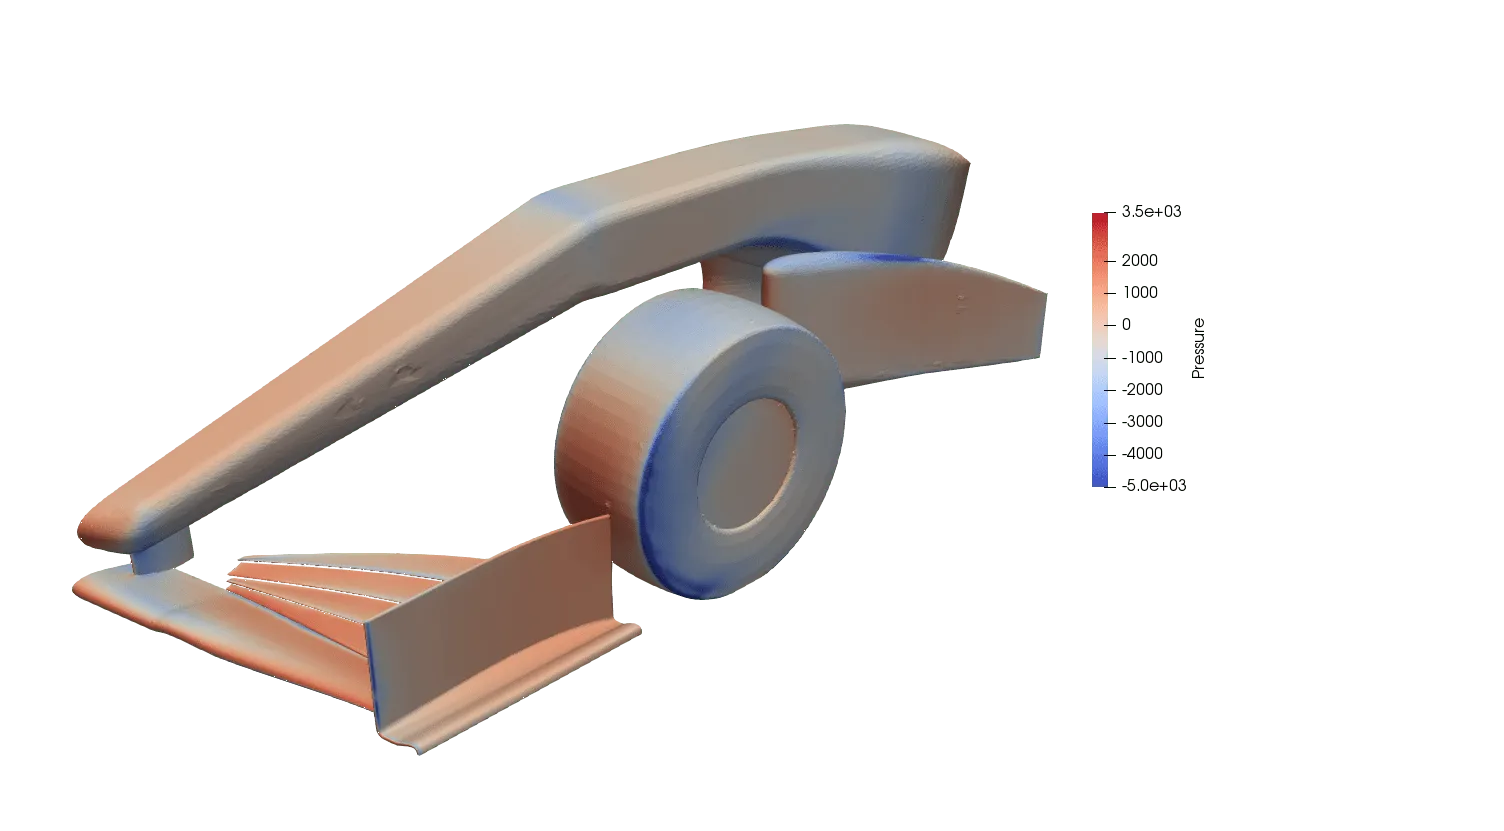
Vibration Testing Basics: Methods and Applications
Vibration testing measures how a structure responds to controlled dynamic excitation, applied by a shaker or an impact hammer and recorded by accelerometers or a laser vibrometer. Two methods cover most work: sine and random. The governing standard specifies the profile used for each.
Key takeaways
Sine testing: sweeps through frequencies one at a time to determine natural frequencies and damping ratios.
Random testing: applies a broadband spectrum defined by a power spectral density to reproduce service conditions.
Excitation: electrodynamic or servo-hydraulic shaker for controlled profiles, impact hammer for modal surveys.
Measurement: accelerometers for control and response, laser Doppler vibrometer, where added mass would shift the result.
Core quantities: PSD in g²/Hz, SRS for transient shock, FRF for the ratio of response to input.
Frequency range: random qualification testing commonly extends to 2 kHz.
Standards: MIL-STD-810 in defense, ISO 16750 in automotive, DO-160 in civil avionics.
The article is written for test engineers who run shaker campaigns and for CAE engineers who correlate finite element models against measured data. It covers the equations governing forced response, the definitions of PSD, SRS, and FRF, the sequence of a test from fixture preparation through data analysis, and the standards that govern qualification in defense, automotive, and avionics. It also explains where vibration data feeds the early concept phases of design. It does not cover acoustic measurement or rotor balancing.
The importance of either test is that vibration destroys hardware that passes every static check. A bracket sized with a comfortable safety margin against its peak load will still crack in service if an engine order or a road input happens to sit on one of its natural frequencies, because the structure amplifies that input and then spends its fatigue life a thousand times faster than the load case predicted. The failures that follow include loose fasteners, fretted connectors, cracked solder joints, and early-failing bearings. Testing finds those frequencies before delivery, when the fix is a stiffening rib rather than a recall.
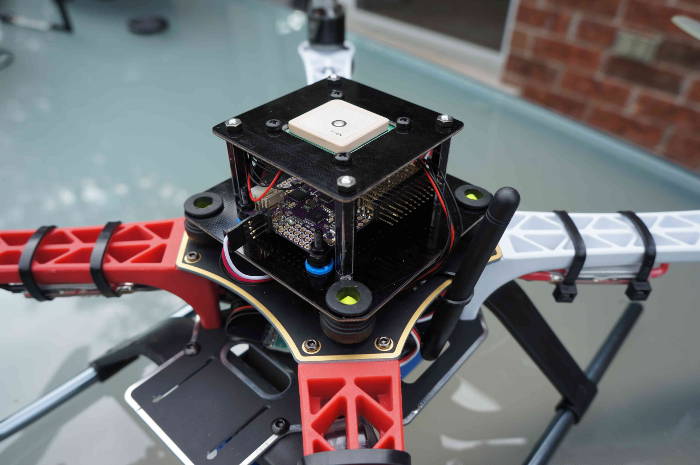
Table of contents
Why is vibration important?
Three pillars for vibration investigations: vibration testing, CAE simulation, and AI
Basic equations for vibration testing
Frequency range in vibration analysis
Practical implementation of vibration testing
How to carry out vibration testing in practice
Random vibration testing
Random vs sine testing
Advanced - frequency response function (FRF)
FAQ
Sources
Why is vibration important?
Vibration-induced mechanical failure occurs when dynamic forces exceed the structural integrity of a component or system, leading to degradation or catastrophic failure. This phenomenon can be explained by structural dynamics and material science, with mathematical formulations illustrating the underlying mechanisms.
Vibration-induced mechanical failure is influenced by fatigue, resonance, and wear factors. With experimental vibration testing and CAE simulation, engineers can predict and mitigate the effects of vibration, thereby enhancing the reliability and longevity of mechanical systems. Physics-aware AI models trained on data from vibration test campaigns and CAE runs evaluate hundreds of geometry variants in the time a solver needs for a handful of load cases, illustrating broader applications of AI in engineering. Such models run at the concept stage, before the geometry is frozen.
Vibration-induced fatigue failure occurs when cyclic loading leads to progressive damage accumulation in a material, ultimately resulting in fracture. The S-N curve, depicting the relationship between stress amplitude (σ) and number of cycles to failure (N), is commonly utilized to characterize fatigue behavior. Mathematically, the S-N curve can be expressed as:
σₘₐₓ = C · N⁻ᵐ
where
N is the number of cycles to failure,
σₘₐₓ is the peak stress of the cycle,
C is the fatigue strength coefficient, and
m is the fatigue exponent.
Excessive vibration can cause stress concentrations and microstructural changes, accelerating fatigue crack initiation and propagation, ultimately leading to failure.
Resonance occurs when a system's natural frequency coincides with the frequency of an external excitation, resulting in amplified vibrations. The dynamic response of a single-degree-of-freedom (SDOF) system subjected to harmonic excitation can be described by the equation:
m d²x/dt² + c dx/dt + k x = F₀ cos(ωt)
Resonance-induced vibrations can lead to excessive stress and displacement amplitudes, causing fatigue failure or structural damage.
Vibration can induce fretting wear and looseness in mechanical assemblies, leading to accelerated degradation and potential failure. The wear rate (W) due to fretting can be quantified using Archard's equation:
W = k · F · s
where
k is the wear coefficient,
F is the normal force, and
s is the sliding distance.
Vibration-induced fretting wear can result in increased clearances, loss of preload, and eventual failure of fasteners or bearings.
Three pillars for vibration investigations: vibration testing, CAE simulation, and AI
Experimental Testing, CAE Simulation, and Artificial Intelligence (AI) are three distinct approaches employed by vibration engineers to analyze and mitigate vibration-related issues in machinery.
Experimental testing
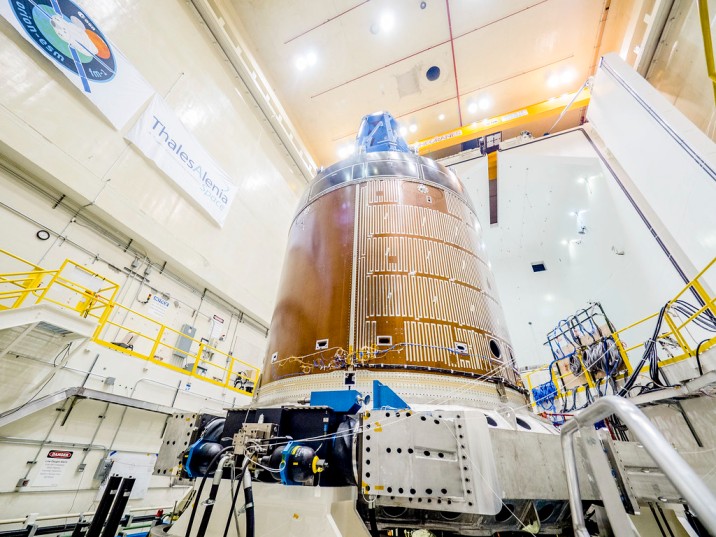
Experimental testing involves the physical measurement and analysis of vibrations in real-world scenarios. Vibration engineers use sensors and data acquisition systems to collect data directly from machinery during operation or controlled tests in laboratory settings. This approach provides accurate and reliable data on vibration levels, frequencies, and other parameters, allowing engineers to diagnose existing problems, validate theoretical models, and assess the effectiveness of mitigation strategies. Experimental testing offers a comprehensive understanding of machinery behavior under operating conditions, making it a valuable tool for vibration analysis and diagnostics.
CAE simulation and vibration analysis
Computer-aided engineering (CAE) simulation involves using computational models and numerical methods to simulate and analyze the behavior of machinery under various vibration conditions. Vibration engineers often begin with a simple model before developing mathematical models of mechanical systems that incorporate factors such as material properties, geometry, boundary conditions, and external loads.
These models are then solved using numerical techniques, such as finite element analysis (FEA), to predict vibration responses, stress distributions, and other relevant parameters.
CAE (Computer-Aided Engineering) 3D simulation enables engineers to explore alternative designs, optimize structural configurations, and evaluate the impact of vibration on system performance without the need for physical prototypes. In the automotive sector, CAE tools support virtual validation of durability and ride comfort. It enables cost-effective and efficient analysis of complex vibration phenomena, facilitating the design and development of robust and reliable mechanical systems.
Artificial intelligence (AI) and vibration analysis
Machine learning reads vibration records at a rate that manual review cannot match. Trained on labeled sensor data, a classifier flags a bearing defect signature in an envelope spectrum well before the fault reaches an amplitude a technician would notice, which is the basis of condition-based maintenance on rotating machinery.
On the design side, physics-aware AI takes a different role. Models trained on archived CAE runs and correlated test results predict modal frequencies and response amplitudes directly from geometry, which moves dynamic assessment into the concept phase. Neural Concept builds this capability as an Intelligence Layer for Engineering, sitting above the existing CAD and CAE tools, with a Design Copilot that returns predicted responses while geometry is still being edited. Similar approaches extend into AI in civil engineering, where models assist with structural analysis and infrastructure planning. The same trained models then support predictive analytics for in-service equipment and, more broadly, AI in structural engineering.
Basic equations for vibration testing
The study of vibrations and oscillations is expressed through fundamental equations in physics.
One such equation, often encountered in the analysis of simple harmonic motion, is the equation governing the displacement x=x(t) attached to a spring with spring constant k:
F = −k x
Here, F represents the force exerted by the spring on the mass, x is the displacement from the equilibrium position, and k is the spring constant.
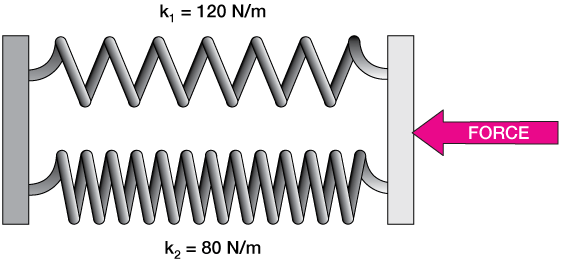
Moreover, analyzing vibrations often involves examining the dynamic behavior of systems encapsulated by equations of motion.
For instance, in the context of a single-degree-of-freedom (1DOF) system subjected to harmonic excitation, a simple model used to explain basic vibration behavior before more complex systems are considered, the equation governing its motion takes the form:
m d²x/dt² + c dx/dt + k x = F₀ cos(ωt)
In this equation, c denotes the damping coefficient, F₀ denotes the amplitude of the harmonic force, and ω represents the angular frequency.
The term F₀ represents the amplitude of the harmonic force acting on the system. While this term directly denotes the force amplitude, it indirectly influences the vibration amplitude of the system's response x(t). The term ω represents the angular frequency of the external harmonic excitation. The angular frequency ω is related to the vibration frequency f (in Hertz) by the equation ω = 2πf.
With these and much more advanced equations, engineers can delve deeper into machinery's vibrational characteristics, enabling them to identify the root causes of issues and devise effective mitigation strategies.
Vibration analysis — is an equation enough?
Vibration testing remains vital for engineers, despite the complexities of solving differential equations like the one above, which represents a simplified model of a vibrating system subjected to external forces. Systems are often more intricate in real-world scenarios, with varying parameters and boundary conditions. Consider a suspension system in an automotive vehicle. The above equation models the motion of the vehicle's suspension subjected to external road disturbances modeled as F0 cos(ωt).
The system's parameters (mass m, damping coefficient c, and spring constant k) may vary due to road conditions, vehicle speed, and payload. Additionally, road disturbances may be complex and difficult to model analytically.
Here, vibration testing allows engineers to study the suspension system's response to real-world road conditions, capturing nonlinearities and variations that analytical solutions may overlook.
Frequency range in vibration analysis
Frequency range refers to the span of frequencies over which the system or component under examination is subjected to vibrational stimuli. The frequency range determines the scope of analysis and the types of vibrations the system will experience.
Expanding on this concept, the frequency range encompasses the lower and upper bounds of frequencies relevant to the particular vibration testing. These frequencies are typically defined based on factors such as the system's natural frequency, expected operating conditions, and the resolution of vibration testing.
The frequency range defines the spectrum of frequencies to consider during the design, vibration testing, and evaluation of a mechanical system.
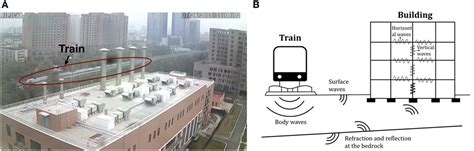
For example, in structural vibration testing of a building, the frequency range may span from a few Hertz (Hz) to several kilohertz (kHz), covering vibrations induced by environmental factors, machinery operation, or seismic events.
Moreover, the frequency range influences the selection of vibration testing equipment, such as shakers and accelerometers, and the setup of test parameters, such as amplitude and duration. Different types of vibration tests, such as sinusoidal, random, or shock tests, may be conducted within specific frequency ranges to assess various aspects of the system's response.
Practical implementation of vibration testing
Beyond theoretical equations, the practical implementation of vibration testing involves a structured approach. Engineers gather preliminary data, measure vibrations, interpret results, and take corrective action. This systematic methodology ensures machinery health by facilitating interventions that maintain optimal operational efficiency.
Furthermore, integrating vibration testing data into Product Lifecycle Management (PLM) systems represents a paradigm shift in maintenance strategies with the integration into the so-called "digital thread." Engineers gain insights into equipment health throughout its lifecycle by merging vibration testing results with PLM systems. This integration streamlines predictive maintenance scheduling and optimizes equipment performance while mitigating operational risks.
Moreover, by coupling vibration testing with Computer-Aided Engineering (CAE) simulations, engineers unlock enhanced collaboration and efficiency possibilities. This is a synergy between product design, testing, and maintenance teams.
Advanced concepts - power spectral density
Power Spectral Density (PSD) quantifies how signal power is distributed across different frequencies in vibration testing. Mathematically, it's the Fourier Transform of the autocorrelation function of a stationary random vibration process. PSD aids in identifying dominant frequencies in machinery vibrations, offering insights into mechanical dynamics and fault detection. The core mathematical equation for the PSD Sₓₓ(f) of a signal x(t) is:
Sₓₓ(f) = limₜ→∞ (1/T) |X(f)|²
X(f) is the Fourier Transform of x(t), and T is the observation time.
Estimation techniques for vibration testing include the periodogram or Welch's method.
The PSD, denoted with Sₓₓ(f), represents the power per unit frequency. Acceleration PSD in shaker testing is quoted in g²/Hz; displacement PSD is in m²/Hz. In simpler terms, PSD illustrates how much power is contained within specific frequency bands of a vibration signal.
In vibration testing, we collect data from vibration sensors, often obtaining signals that vary over time. These signals represent the vibrations experienced by machinery and can be complex, containing contributions from various frequencies. The Fourier Transform provides a mathematical tool for decomposing time-domain signals into their constituent frequency components.
More on the Fourier transform
Mathematically, the Fourier Transform takes a time-domain signal, such as the vibration signal collected from sensors, and transforms it into the frequency domain. This transformation reveals the amplitudes and phases of the signal's frequency components.
In vibration testing, the Fourier Transform allows engineers to identify the dominant frequencies, harmonics, and other spectral characteristics of signals. This information is essential for understanding the underlying causes of vibrations, such as resonance or external excitation, and designing effective mitigation strategies.
Furthermore, in the context of the Power Spectral Density (PSD) analysis mentioned in the text, the Fourier Transform is used to calculate a signal's PSD. The PSD provides insights into how signal power is distributed across different frequencies, aiding in identifying dominant frequencies and assessing the overall energy distribution in the vibration signal.
Advanced concepts - random vibration test
Alongside deterministic vibrations driven by known forces, we encounter the phenomenon of Random Vibration. This chapter elucidates the concept of Random Vibration and its implications for (random) vibration testing in machinery diagnostics, building on Power Spectral Density (PSD) analysis.
Random vibration arises from stochastic processes and is characterized by unpredictable fluctuations in amplitude and phase over time; unlike deterministic vibrations with well-defined inputs, a random test contains many frequencies within a defined range to better simulate service conditions, and random vibration results from inherent uncertainties or external disturbances.
Random Vibration poses unique challenges in machinery diagnostics due to its stochastic nature. It represents real-world operational conditions influenced by diverse factors such as environmental or material properties.
In vibration testing, random vibration manifests as broadband spectra with no discernible dominant frequencies. Analyzing the PSD of random vibration signals enables engineers to assess the overall energy distribution across frequency bands, aiding in fault detection and machinery health monitoring. Duration follows the governing standard: ISTA 3A random vibration runs 60 minutes per axis across three axes, while a short screening test may run 15 minutes per axis.
Mathematically, a random vibration process x(t) can be described using stochastic differential equations or through its statistical properties.
The autocovariance function Rₓₓ(τ) captures the correlation between random vibration x(t) values at different times τ:
Rₓₓ(τ) = E[x(t) · x(t+τ)]
Where E[⋅] denotes the expected value operator. From the autocovariance function, the PSD Sₓₓ(f) of the random vibration process can be obtained via the Fourier Transform described in the previous chapter, providing the statistical basis for the random profile used to build the test input.
How to carry out vibration testing in practice
Vibration tests require a systematic approach, such as the one outlined in this chapter. A process is needed to effectively evaluate the dynamic response of vibration test specimens and to inform decisions on design improvements, quality assurance, and maintenance strategies.
Preparation phase
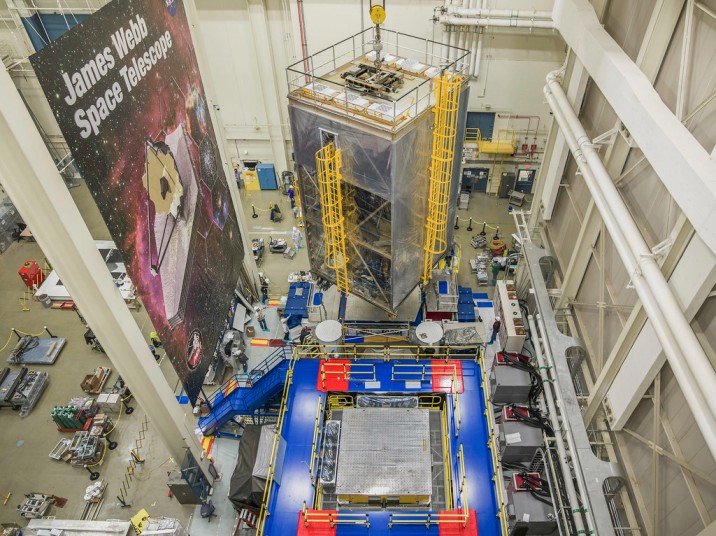
First, we clearly define the objectives of vibration tests, including the parameters to be measured, the test duration, and the vibration test conditions. We then select appropriate vibration testing equipment, such as shakers, accelerometers, and data acquisition systems, based on the test requirements and the specimen's or device's characteristics, ensuring each accelerometer signal is correctly routed to its corresponding input channel. In the preparation phase of vibration tests, we ensure the specimen is securely mounted to the vibration test fixture to prevent unwanted movement or resonance during testing. Consideration should be given to the orientation and mounting configuration so the mounted device reflects realistic operating conditions.
Execution phase
To conduct a vibration test, we suggest following the steps below:
Set up the vibration test equipment according to the test specifications. This includes placing and calibrating accelerometers, configuring the shaker, and connecting data acquisition systems so the setup matches the required test parameters for the chosen method.
Conduct baseline measurements to establish the initial vibration levels and verify the functionality of the vibration test setup.
Using the vibration shaker, apply the desired vibration test excitation profile to the test specimen. Depending on the vibration test objectives, the excitation profile may include sine, random, or swept-sine vibrations.
Durability procedures run far longer than functional ones. MIL-STD-883 Method 2005 vibration fatigue holds a constant 20 g peak acceleration at 60 ±20 Hz for 32 ±8 hours in each of the three axes under test condition A.
Continuously monitor test conditions, such as vibration amplitude, frequency, and temperature, throughout the test to ensure consistency and reproducibility.
Analysis phase
As vibration testing engineers, we capture vibration data using the data acquisition system, and the analysis relies on recorded data from accelerometers and any other relevant parameters, such as displacement or velocity. In FDR tests, the shaker reproduces pre-recorded signals for comparison or replay-based analysis.
We analyze the collected vibration data to assess the specimen's dynamic response. This may involve calculating key metrics such as peak acceleration, resonant frequencies, damping ratios, and maximum displacement in mode-shape or resonance analysis.
Finally, we compare the test results against predefined acceptance criteria or industry standards to evaluate the performance and structural integrity of the vibration test specimen. Identify any deviations or anomalies that may require further investigation or corrective action.
Random vibration testing
To initiate random vibration testing effectively, the objectives must be defined to align with the system's real-world operating conditions. This should encompass the desired input spectrum, test duration, and acceptance criteria, all of which aim to emulate realistic dynamic environments.
We must select vibration testing equipment suitable for generating and measuring random vibration signals. This equipment should include shakers, accelerometers, and data acquisition systems capable of accurately replicating random vibration profiles.
Then, our task is to develop a comprehensive test profile that mirrors the expected vibration conditions during real-world operation. We choose from various spectrum types, such as Gaussian, PSD, or SRS (Shock Response Spectrum), to accurately simulate the unpredictable and dynamic nature of random vibrations.
Shock response spectrum in random vibration testing
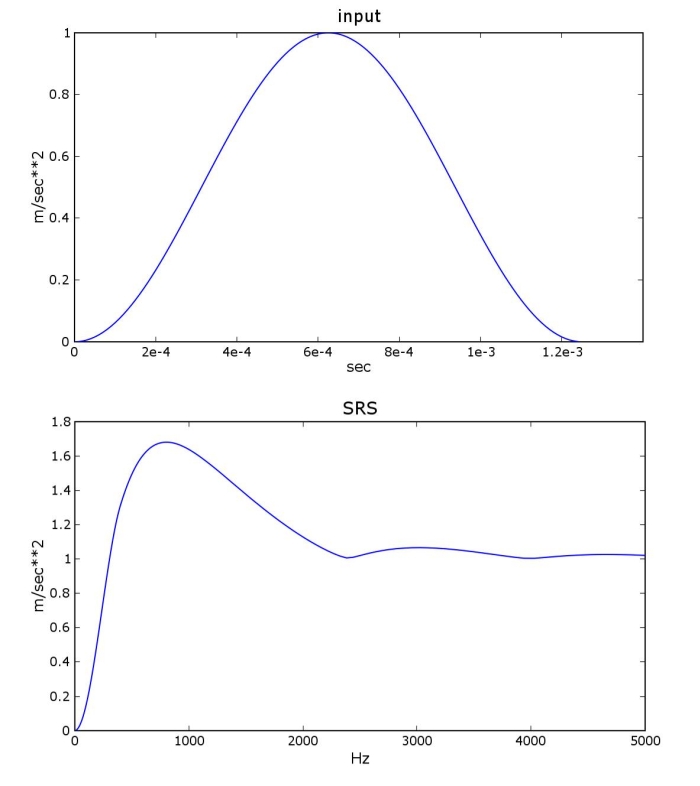
The Shock Response Spectrum (SRS) is a graphical representation that depicts the dynamic response of a mechanical system to transient shock inputs across a range of frequencies. Unlike traditional frequency domain analyses, which focus on sinusoidal or random vibrations, the SRS characterizes the system's response to impulsive loads, such as shocks or impacts. SRS is implemented in various engineering disciplines, including aerospace, automotive, and structural engineering. Engineers utilize the SRS to assess the robustness of components and structures against shock-induced failures,
SRS helps identify critical resonant frequencies and vibration modes that may amplify the effects of transient shock loads, leading to structural damage or failure.
The Shock Response Spectrum is typically represented graphically, with acceleration amplitude plotted against frequency.
Mathematically, the SRS can be derived from the response of a single-degree-of-freedom (SDOF) system subjected to an impulse or step input.
m d²x/dt² + c dx/dt + k x = F₀ δ(t)
The symbol δ(t), often called the Dirac delta function, represents a mathematical concept used in engineering and physics to model impulsive phenomena. In other words, δ(t) signifies a function that is zero for all values of t except at t = 0, where it has an infinitely high and narrow peak such that its integral over the entire real line equals one. It describes an instantaneous impulse or spike occurring at time t = 0, with no duration but possessing a finite area under the curve. This mathematical abstraction is advantageous in representing idealized point loads, such as sudden impacts or impulses, in various dynamical systems and differential equations.
Random vs sine testing
Random vibration testing and sine-sweep vibration testing are two common methods for assessing the dynamic response and structural integrity of mechanical systems.
| Dimension | Random vibration testing | Sine (sine-sweep) testing |
|---|---|---|
| Excitation | Broadband spectrum, many frequencies at once | One frequency at a time, swept through a range |
| Input definition | Power spectral density, in g²/Hz | Amplitude versus frequency, with a sweep rate |
| What it reproduces | Service conditions: road, flight, transport | One resonance at a time, and rotating-machine orders |
| Primary output | Response PSD and energy distribution across bands | FRF, natural frequencies, damping ratios, mode shapes |
| Typical use | Qualification and durability against real environments | Modal analysis, resonance search, fatigue at a known frequency |
| Governing methods cited here | MIL-STD-810 Method 514.8, IEC 60068-2-64, ISTA 3A, SAE J2380 | IEC 60068-2-6, UN 38.3 Test T3, MIL-STD-883 Method 2005 |
| Main limitation | No dominant frequency to inspect; results need statistical interpretation | Does not reproduce simultaneous multi-frequency loading |
In random vibration testing, the excitation signal consists of a broad spectrum of frequencies with varying amplitudes, simulating real-world operational conditions where input forces are unpredictable and stochastic. This method is beneficial for assessing a system's robustness against vibrations encountered in everyday use, such as those caused by road conditions, machinery operation, or environmental factors like wind and waves. Engineers analyze the PSD of the random vibration signal to understand how the energy is distributed across different frequency bands. This helps identify resonant frequencies, assess structural damping, and detect potential weaknesses or fatigue issues in the system.
In sine on random, sinusoidal content is superimposed on a random environment to better represent complex operating conditions.
Random on random is another combined method in which additional random bands are added over a base random signal.
In these hybrid profiles, sine tones provide the added tonal content used to reproduce structural responses more realistically.
Sine testing
On the other hand, sine testing applies a single-frequency sinusoidal excitation signal to the system, typically at varying amplitudes or frequencies to characterize its response under different conditions, hence the name "sine testing". This method is commonly used for modal analysis, where engineers seek a structure's natural frequencies, damping ratios, and mode shapes. Sine testing is also used for durability testing, in which components are subjected to repeated sinusoidal vibrations to assess their fatigue life. Engineers analyze the system's FRF, which describes its dynamic response to sinusoidal excitation across a range of frequencies. This allows them to determine resonant frequencies, modal parameters, and frequency-dependent damping characteristics.
In summary, random vibration testing mimics real-world vibration conditions across a broad frequency spectrum, making it suitable for assessing overall system performance and durability. Sine vibration testing, on the other hand, focuses on characterizing specific dynamic properties of a system through controlled sinusoidal excitation. Both testing methods complement each other and are valuable tools in the vibration analysis toolbox, depending on the specific objectives and requirements of the testing scenario.
A vibration testing system is a crucial apparatus used to subject test specimens to controlled vibrational inputs. These inputs typically involve applying harmonic, random, or swept sine vibrations to simulate real-world operating conditions. One essential aspect of a vibration testing system is its ability to ensure that all components of the test specimen vibrate at the same frequency. This synchronization is vital for accurately replicating the dynamic environments that machinery encounters during operation.
Advanced - frequency response function (FRF)
During vibration testing, engineers measure the specimen's response, such as acceleration or displacement, while applying harmonic excitation across a range of frequencies. The FRF is then obtained by taking the ratio of the output response to the input excitation at each frequency. A waterfall plot can complement this by showing how measured spectra evolve over time during run-up or coast-down testing.
FRF provides crucial information about the system's natural frequencies, resonance peaks, damping ratios, and amplification factors. Engineers can analyze the FRF to identify resonant frequencies, assess damping characteristics, and evaluate structural integrity. Moreover, the FRF aids in validating analytical models, calibrating simulation parameters, and optimizing design parameters to meet performance requirements. The FRF is mathematically represented as the ratio of the system's output response to the input excitation in the frequency domain.
Denoted as H(ω), where ω represents the angular frequency, the FRF is expressed as:
H(ω) = X(ω) / F(ω)
where
X(ω) is the Fourier Transform of the system's output response
F(ω) is the Fourier Transform of the input excitation.
From measured data to predicted dynamics
Every campaign produces data that outlives the campaign. Accelerometer records, the correlated finite element model, and the geometry that produced both form a training set. A physics-aware model learns the mapping from shape to dynamic response, then returns a predicted response for a geometry that has never been built or instrumented. Neural Concept delivers that as an Intelligence Layer for Engineering for physical products, sitting above the CAD and CAE tools already in use, with an AI Design Copilot that answers while the geometry is still open in the editor.
The effect shows up wherever dynamic behavior drives the design. MAHLE designed a new radial blower this way, exploring 30 million design iterations and reaching 15% higher efficiency with 4 dB less noise. General Motors applied the same approach to pedestrian safety across 11 vehicle programs, returning assessments in seconds where the simulation chain took weeks. The measured data still sets the reference; the model is what makes it reusable on the next geometry.
Ready to know how a structure will behave dynamically before the shaker is booked?
Explore the platform →FAQ
What vibration testing standards apply to my industry (e.g., MIL-STD-810, ISO 16750, DO-160)?
The governing standard follows the platform. Defense and ground equipment use MIL-STD-810H, issued in January 2019, where Method 514.8 covers vibration and Method 527 covers multi-exciter testing; the document is written for tailoring, so the profile is derived from the life cycle environmental profile of the specific program. Automotive electrical and electronic components use ISO 16750-3:2023, the fourth edition, which revised the vibration profiles against extended vehicle datasets. Civil avionics use RTCA DO-160G Section 8, published in 2010 and still the referenced revision, with categories fixed by aircraft type and installation zone; RTCA has announced a DO-160H revision. Packaged product in distribution falls under ASTM D4169 or the ISTA 3-series, and general electrotechnical equipment under IEC 60068-2-64 for random and IEC 60068-2-6 for sine.
Should I outsource vibration testing to a certified lab or invest in in-house equipment?
Two questions settle it: whether the result must serve as certification evidence and how often the shaker would run. Qualification reports submitted to a customer or a regulator normally require a laboratory accredited to ISO/IEC 17025 for the specific method, and that accreditation is hard to justify for a single product line. In-house equipment earns its cost when vibration testing sits inside the development loop, where a shaker available the same day shortens the interval between a design change and a measured result. A common arrangement is to keep a modest electrodynamic shaker in-house for development screening and send formal qualification to an accredited lab.
What is the difference between vibration isolation and vibration damping as mitigation strategies?
Isolation changes the transmission path; damping dissipates energy. An isolator is a soft mount tuned so its natural frequency sits well below the excitation frequency. Transmissibility falls below unity only once the ratio of excitation frequency to mount natural frequency exceeds √2; below that crossover, the mount amplifies the input. Damping cuts the peak at resonance, which matters during run-up and coast-down when a machine sweeps through the mount frequency. Above the crossover ratio, added damping raises the transmitted level. Practical mounts therefore combine a low natural frequency with enough damping to survive the resonance crossing.
What common fixture design mistakes cause invalid or misleading vibration test results?
Most invalid results trace to a small number of setup errors. A fixture whose first mode falls inside the test band amplifies at that frequency, so the specimen receives a level the controller never commanded; the usual target places the first fixture mode at two to three times the highest specimen resonance, meaning 4 to 6 kHz for a random test running to 2 kHz. A control accelerometer positioned at a node, or away from the mounting interface, holds level only at its own location and hides the response at the specimen. Over-constraining the specimen raises its natural frequencies and underestimates fatigue damage, while under-constraining permits motion that never occurs in service and produces connector fretting and fastener loosening that are then blamed on the design. An unstable payload can also exceed the shaker overturning moment rating, and unsecured cables inject triboelectric noise into the measurement.
How does combined environment testing (e.g., temperature plus vibration) affect test outcomes?
Simultaneous stresses produce failure modes that neither stress produces alone at the same severity. Elevated temperature softens solder joints and adhesive bonds and lowers their resistance to vibration-induced cyclic stress, so a joint that survives a vibration profile at 23 °C can fail quickly under the same profile at 85 °C. MIL-STD-810, IEC 60068, and DO-160 all accommodate combined temperature and vibration profiles. HALT applies step-stress thermal cycling together with multi-axis repetitive shock to find design limits; it yields no compliance evidence, and its results feed design changes instead.
What are the vibration testing requirements for EV battery packs and lithium-ion batteries?
Transport approval and vehicle approval use different tests. UN 38.3 Test T3 applies a logarithmic sine sweep from 7 Hz to 200 Hz and back in 15 minutes, repeated 12 times for a total of 3 hours in each of three mutually perpendicular orientations; Test T4 follows with half-sine shocks of 150 g for 6 ms on small cells and 50 g for 11 ms on large ones. Vehicle type approval in Europe is governed by UNECE R100 for four-wheel vehicles and R136 for two-wheel vehicles. For durability, SAE J2380 applies random spectra derived from road measurements and scaled to represent 100,000 miles of service, IEC 62660-2 covers cell-level reliability and abuse testing, and ISO 19453-6 covers traction battery packs within the electric propulsion drive system.
How do laser Doppler vibrometers compare to traditional contact accelerometers?
A laser Doppler vibrometer measures surface velocity from the Doppler shift of backscattered light, so it adds no mass to the specimen. Mass loading from a contact accelerometer shifts the measured natural frequencies, and the shift becomes significant on thin panels and turbine blades, where even the smallest accelerometer alters the resonance being measured. Scanning heads also reposition the measurement point faster than an accelerometer can be moved and re-bonded, which shortens a dense modal survey. Accelerometers remain the choice for shaker control loops and for any measurement without optical line of sight, and they cost far less; the vibrometer needs alignment time and adequate surface reflectivity.
What's the difference between operational vibration testing and transportation vibration testing?
Operational vibration testing reproduces the excitation the equipment sees while running, derived from measurements on its own platform, with the specimen powered and monitored for function throughout. Transportation vibration testing reproduces the distribution environment acting on the packaged product, with the specimen usually unpowered and the criterion being arrival without damage. The transport profiles come from field measurement campaigns on trucks and aircraft: ISTA 3A runs random vibration for 60 minutes per axis in three axes, and ASTM D4169 Schedule E uses truck profiles at 0.40, 0.54, and 0.73 Grms. MIL-STD-810 Method 514 Procedure II covers the loose cargo case separately.
Sources
MIL-STD-810H, Environmental Engineering Considerations and Laboratory Tests, US Department of Defense, January 2019 — Method 514.8 (vibration), Method 527 (multi-exciter testing).
MIL-STD-883, Test Method Standard: Microcircuits, Method 2005 — vibration fatigue, test condition A.
ISO 16750-3:2023, Road vehicles — Environmental conditions and testing for electrical and electronic equipment — Part 3: Mechanical loads, fourth edition.
RTCA DO-160G, Environmental Conditions and Test Procedures for Airborne Equipment, Section 8 — Vibration, 2010.
IEC 60068-2-64, Environmental testing — Test Fh: Vibration, broadband random.
IEC 60068-2-6, Environmental testing — Test Fc: Vibration (sinusoidal).
ASTM D4169, Standard Practice for Performance Testing of Shipping Containers and Systems — Schedule E, truck profiles.
ISTA 3A, Packaged-Products for Parcel Delivery System Shipment.
United Nations, Manual of Tests and Criteria, Section 38.3 — lithium metal and lithium-ion batteries, Tests T3 and T4.
UNECE Regulation No. 100 (four-wheel electric vehicles) and Regulation No. 136 (two-wheel electric vehicles).
SAE J2380, Vibration Testing of Electric Vehicle Batteries.
IEC 62660-2, Secondary lithium-ion cells for the propulsion of electric road vehicles — Part 2: Reliability and abuse testing.
ISO 19453-6, Road vehicles — Environmental conditions and testing for electrical and electronic equipment for drive system of electric propulsion vehicles — Part 6: Traction battery packs and systems.
ISO/IEC 17025, General requirements for the competence of testing and calibration laboratories.
Appendix — abbreviations
CAE — computer-aided engineering
FEA — finite element analysis
FRF — frequency response function
PSD — power spectral density, in g²/Hz for acceleration
SRS — shock response spectrum
SDOF — single degree of freedom
Grms — root-mean-square acceleration of a random profile, in g
HALT — highly accelerated life testing
LDV — laser Doppler vibrometer
PLM — product lifecycle management