F1 Aerodynamics — Shape predictions & optimization with Neural Concept
F1 aerodynamics is the practice of shaping and refining airflow around the car to maximize downforce and minimize drag, because small gains in grip, stability, and straight-line efficiency can decide lap time and race results. For motorsport and automotive engineering enthusiasts, aerodynamicists, and engineers exploring how modern design workflows are changing, this article explains how AI-native engineering intelligence is moving teams beyond isolated CFD runs toward systematic exploration of the design space.
It covers the core design challenges in f1 aerodynamics, the roles of the front and rear wings, how teams measure aerodynamic performance, where traditional CFD and wind-tunnel methods still matter, how regulation constrains development, and how platforms such as Neural Concept use synthetic datasets, simulation, and AI to accelerate aerodynamic design decisions.
The 2026 technical regulations reset the aerodynamic baseline. Downforce fell by about 30 percent and drag by about 55 percent, and the minimum weight fell from 800 kg to 768 kg. The Venturi tunnels that defined the 2022 to 2025 cars have been replaced by a partially flat floor and a larger diffuser, and the drag reduction system has given way to movable front and rear wings, mirroring how AI-designed high-performance cars increasingly exploit active aerodynamics and advanced materials.
F1 engineering is one of the most demanding design environments in the world. A front wing profile refined through dozens of CFD iterations might yield two hundredths of a second per lap. At this level, that is the difference between the podium and the points.
CFD emerged as a major development tool in the 1990s, progressively reducing dependence on physical testing by cutting the time and cost of evaluating new configurations. However, a constraint remained: engineers could explore only a handful of designs at a time, limited by FIA-imposed caps on wind tunnel runs and CFD computational allocation, compounded by the cost of high-performance computing and the sheer complexity of aerodynamic interactions.
Today, engineering teams can continuously evaluate thousands of aerodynamic configurations throughout the full design cycle. Neural Concept was built to make this possible by incorporating an intelligence layer into the design, assisting aerodynamics teams.
This article covers what becomes possible when AI models trained on legacy CFD data remove the one-simulation-at-a-time constraint and enable truly simulation-driven design workflows. F1 aerodynamics is the demonstration case. The article is for anyone interested in motorsport and automotive engineering who wants to understand both the technical method and the organizational shift behind AI-driven design space exploration.
The Engineering Intelligence layer means that navigating the design space is no longer the exclusive territory of simulation specialists:
A CAD engineer can evaluate the aerodynamic consequences of a geometry change before a single mesh is built.
A wind tunnel engineer can cross-reference physical test results against thousands of predicted configurations.
Table of contents
Key takeaways
Why is more downforce needed in F1 cars' aerodynamics?
CFD technology overview
Crucial role of front and rear wings
Method overview: from wind tunnel testing to AI
F1 use case
F1 use case - conclusion
FAQ
Sources
Key takeaways
From isolated simulations to continuous design exploration. AI-native Engineering Intelligence removes the one-simulation-at-a-time constraint. Engineers can evaluate thousands of aerodynamic configurations across the full design cycle, turning the design space from a sample into a searchable asset.
Legacy aerodynamic data as a strategic asset. Simulation archives that previously served as project records are now used as training data. Organizations that treat accumulated engineering data as institutional knowledge build a compounding advantage that grows more precise with every design cycle.
Engineering Intelligence for the full team. Domain engineers operate AI-native workflows without needing machine learning or CFD expertise, broadening the pool of contributors to aerodynamic design decisions. Simulation-driven exploration is no longer confined to CFD specialists.
Why is more downforce needed in F1 cars' aerodynamics?
More downforce is needed because it increases the normal load on the tires without adding inertial mass, giving them the grip required to sustain lateral loads several times the car's weight in high-speed corners. Published figures for the previous generation of cars put high-speed cornering loads in the 4G to 6G range, and the 30 percent reduction in downforce introduced in 2026 lowers these peaks. Without sufficient downforce, an F1 car loses lateral traction through high-speed corners long before its mechanical limits are reached.
In high-velocity motorsport environments, optimizing F1 aerodynamics is a complex balancing act between minimizing drag on straights and maximizing downforce through corners.
Generating significant downforce (i.e., a “negative lift”) fundamentally alters the vehicle's dynamic operating envelope by increasing the normal load on the tires without adding inertial mass. This aerodynamic loading amplifies the tires' coefficient of friction, delivering the essential lateral and longitudinal traction required to sustain high cornering loads, while maintaining high-speed directional stability across variable circuit geometries.
Earlier generations of Formula 1 cars reached the point where total downforce equaled the car's own weight at around 150 km/h, and the ground-effect cars raced between 2022 and 2025 reached it at even lower speeds. The 2026 regulations reduce peak downforce by about 30 percent while cutting the minimum weight from 800 kg to 768 kg, which raises the speed at which the car meets that threshold. Precise aerodynamic telemetry remains team-confidential.
Unlike standard passenger cars or trucks, where the primary objective is streamlining to minimize air resistance, an F1 car intentionally incorporates high-drag aerodynamic appendages. This design compromise is necessary because negotiating complex, high-velocity racing circuits demands localized tire planting and high maneuverability rather than pure straight-line streamlining.
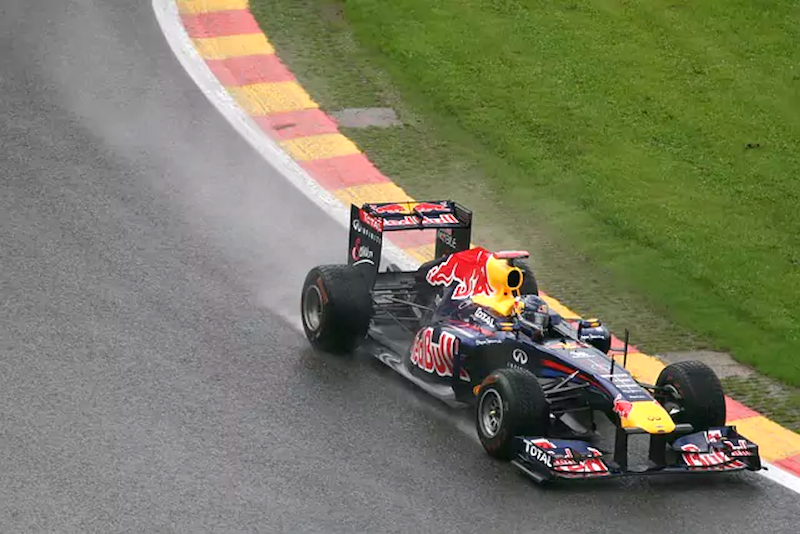
Ultimately, every individual appendage on the chassis serves a deliberate aerodynamic purpose. The core engineering objective extends beyond minimizing fluid resistance to controlling it, so that the car maximizes downforce, safely manages downstream wake structures, and maintains contact patch loading through high-speed corners.
Fundamentals of F1 aerodynamics and aerodynamic performance
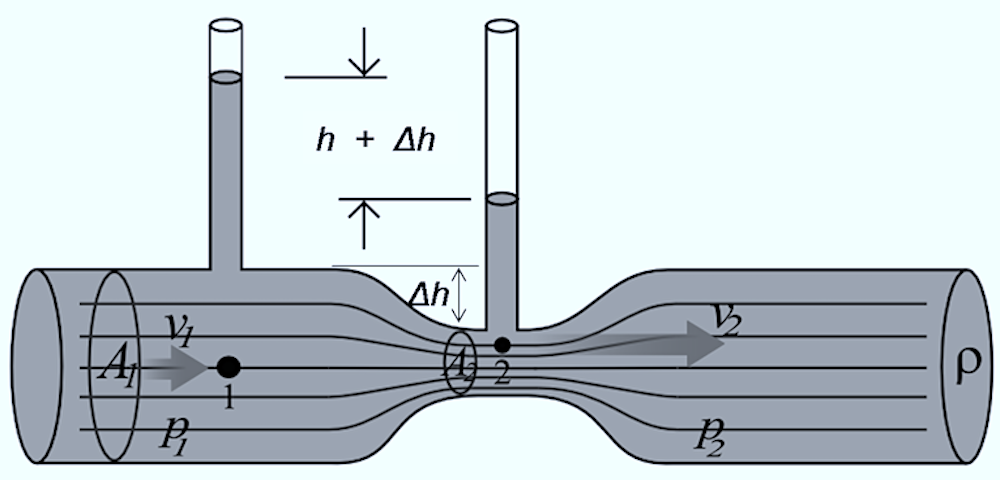
Aerodynamic performance depends on manipulating fluid velocity and static pressure differentials across the vehicle's surfaces.
Classic upper-body profiles used inverted wing profiles to create high-pressure zones above the car, and earlier concepts relied more on a flat floor than today's tunnel-led layouts.
The 2022 to 2025 cars used underbody Venturi tunnels to accelerate airflow beneath the chassis, creating low-pressure zones. This floor geometry creates a powerful suction effect that effectively pulls the car toward the track surface, with ground effect referring to accelerating air under the car to increase grip while reducing drag.
The 2026 cars remove the tunnels. A partially flat floor and a much larger rear diffuser replace them, and movable front and rear wings redistribute drag and downforce across track sectors.
The development cycle for the 2022 regulations focused heavily on maximizing underbody ground-effect suction. The 2026 regulations rebalance that equation by reducing reliance on underbody floor area and introducing active aerodynamic surfaces that switch between a high-downforce corner mode and a low-drag straight-line mode.
How to measure downforce? Traditional aerodynamic testing
Traditional aerodynamic testing measures downforce using multi-component force balances and load cells integrated into a wind tunnel's rolling road system, which capture vertical, lateral, and longitudinal forces in real time as the scale model is subjected to controlled airflow.
Validating these pressure differentials and overall aerodynamic performance has historically relied on a combination of physical prototyping and scale-model wind-tunnel testing. To precisely measure downforce under controlled laboratory conditions, aerodynamicists utilize specialized multi-component balances and high-precision load cells integrated directly into the wind tunnel's rolling road system. These instruments capture localized vertical, lateral, and longitudinal forces in real time, mapping how the vehicle's aerodynamic response varies with minute adjustments in pitch, roll, yaw, and static ride height.
To bridge the gap between static laboratory data and dynamic track environments, trackside engineering teams deploy physical sensor arrays directly onto the chassis during Friday practice sessions.
Specialized Pitot-static tubes and comprehensive aerorakes map localized stagnation and static-pressure differentials across key regions, such as the front-wing wake or rear diffuser exit. By translating these raw pressure readings into local dynamic pressure gradients, aerodynamicists can calculate real-world flow velocities, evaluate boundary-layer separation, and verify whether the physical car matches the intended performance profile.
How to measure downforce? Traditional computational fluid dynamics
CFD measures downforce by creating a digital model of the car and its surroundings, simulating airflow through numerical solvers, and computing the resulting aerodynamic forces on each surface element, including the net vertical force that constitutes downforce.
Starting in the 90s, wind tunnel testing began to be assisted by 3D engineering computations, or CFD Computational Fluid Dynamics
In today's teams, engineers rely on high-fidelity numerical aerodynamic simulations (i.e., CFD) to assess the effects of car design variations without building a prototype and conducting wind tunnel testing.
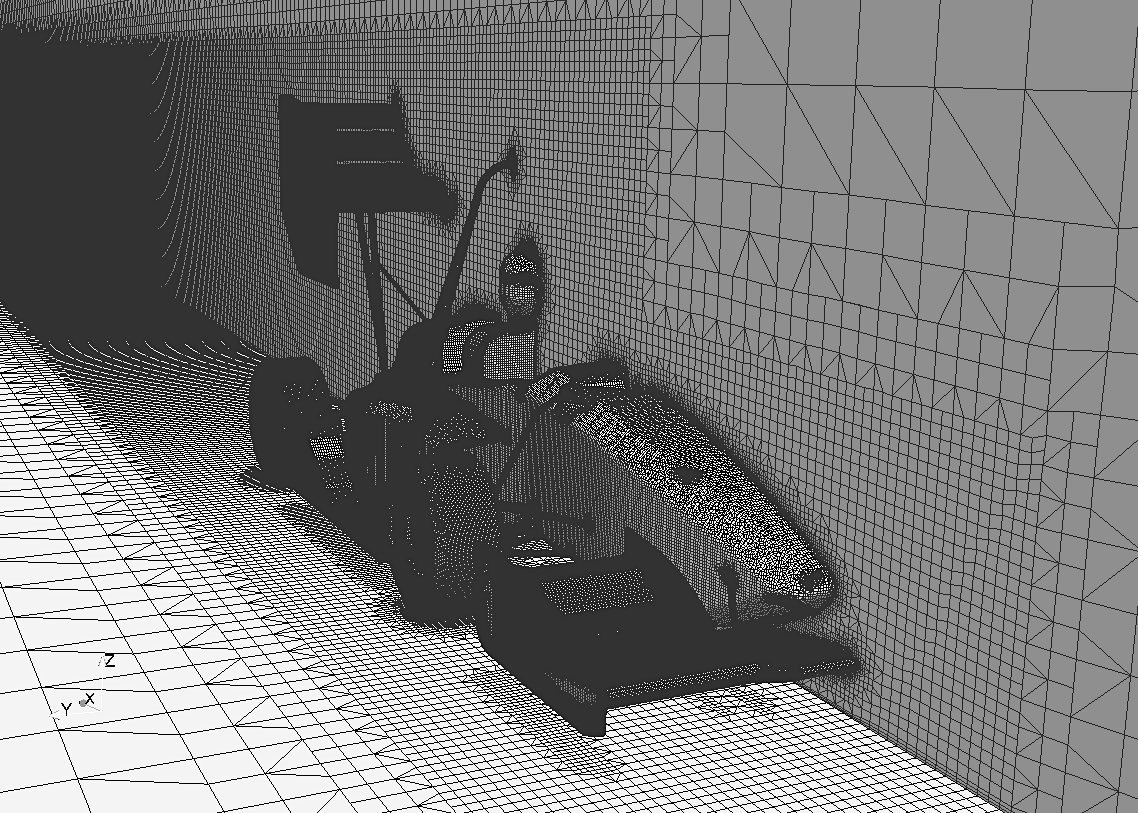
Measuring downforce with CFD involves creating a digital model of the F1 car and its surroundings, including the track and other vehicles. The model includes boundary conditions such as simulated velocity and wall roughness, as well as state-of-the-art computational meshes. The model is then used to simulate airflow around the car and calculate the aerodynamic forces acting on it. This can include the amount of downforce generated.
It is important to note that a CFD F1 simulation will not run on a desktop computer.
It's much more than increasing downforce
For the sake of space, we have focused on downforce, its measurement, and how to compute it. However, other aerodynamic phenomena are relevant.
Wake structures. The wake of a car creates two distinct effects on the following vehicle. On straights, slipstreaming inside the low-pressure wake reduces drag, allowing the trailing car to carry more speed into a braking zone. In corners, the same turbulent wake disrupts airflow over the front wing, making handling worse and reducing aerodynamic load. This turbulent wake is known as dirty air, as opposed to the clean air a leading car enjoys undisturbed. The 2026 bodywork rules address the problem at the source by mandating simpler front wings and in-wash bargeboards that keep the front-wheel wake closer to the car.
External factors. Managing airflow is crucial for cooling the power unit and hybrid system components in F1 cars. The 2026 power units split output roughly evenly between the internal combustion engine and the electrical side, with the MGU-K rated at 350 kW, which raises the cooling load the bodywork must carry. Wind direction affects car handling and downforce levels. High altitude reduces air density, impacting downforce generation. For instance, in Mexico, lower air density results in less downforce than in Monaco. Also, weather changes can significantly influence aerodynamic performance.
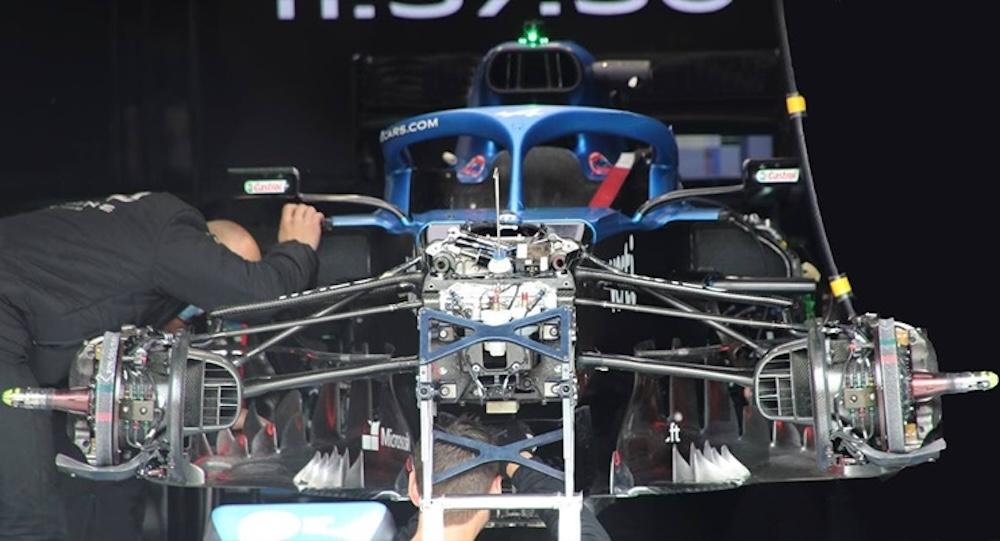
Brake ducts and thermal management. When braking from 300 km/h to 80 km/h in under two seconds, a car generates extreme heat in the wheel assembly. Brake ducts channel airflow directly to the carbon discs. Their geometry also affects the aerodynamic wake around the front tire. Brake duct design is always a compromise between cooling and aerodynamic load.
CFD technology overview
The Navier-Stokes equations are at the core of all fluid processes, including aerodynamics. They describe the motion of fluids (with other equations and several assumptions).
∂u/∂t + u · ∇ u = -(1/ρ) ∇ P + ν ∇²u
Here, u is the fluid velocity, P is the fluid pressure, and ρ is the density.
Unfortunately, there is no general analytical solution to the Navier-Stokes equations. In general, solutions to the equations require numerical approximations such as CFD.
Numerical tools such as CFD can compute the fluid's velocity, pressure, and temperature at different points in 3D space within the simulation domain, starting from the car's CAD model.
Navier-Stokes and other equations can be solved in CFD in several ways, such as the Finite Volume Method.
How does the finite volume method discretize fluid flow?
The finite volume method discretizes fluid flow by dividing the continuous simulation domain into millions of small control volumes, then enforcing conservation of momentum, mass, and energy across each cell's faces through numerical flux calculations rather than solving the governing equations in continuous form.
Key Question: Why does discretization determine how fast an F1 team can iterate on car design?
A tenth of a second per lap separates positions in the constructors' championship, and the finite volume method determines how quickly aerodynamic insight accumulates. Traditional Navier-Stokes solvers process complex geometries by dividing continuous physical space into millions or billions of discrete control volumes, and the cost of that division, measured in computation time and engineering cycles, sets the ceiling on how much of the design space a team examines in a season.
A clear example of this is the fundamental mathematical basis of standard CFD codes: the Elementary Finite Volume Scheme with an Upwind approximation.
We start from the integral form of a conservation equation for quantity φ (momentum, energy, etc.) over a control volume V bounded by a surface S,
∫∫∫ ∂φ/∂t dV + ∬ Φ dS = ∫∫∫ Q dV
where Φ is the flux of φ through the surface, and Q is the source term: any process generating or dissipating φ within V.
To transition from physics to numerics (assume steady-state and incompressible flow), the integral over continuous domains becomes a summation over discretized computational cells of volume Vᵢ and face Aᵢ:
∑ᵢ Φᵢ × Aᵢ = ∑ᵢ Qᵢ × Vᵢ
For each computational cell, the net flux of φ through all faces equals the net source generated within the cell volume.
Elementary finite volume scheme - upwind
Key Question: Why can't the solver simply use the value at the current cell to estimate flux?
Problem: In a convection-dominated flow, using a centered difference to estimate φ at a cell face ignores the direction the fluid is actually traveling. The result is numerical instability: oscillations that corrupt the solution and, in practice, cause the simulation to crash before a result is produced.
Solution: The upwind scheme forces the solver to look upstream. The derivative of φ at cell i is approximated as:
∂φ/∂x ≈ (φᵢ - φᵢ₋₁) / Δx
where φᵢ is the value at the current cell, φᵢ₋₁ is the value at the upstream cell, and Δx is the distance between the two cell centers.
Balancing flux in against flux out gives the net rate of change of φ inside cell i, and integrating over the cell volume yields the discrete update rule:
φᵢⁿ⁺¹ = φᵢⁿ - (u · Δt / Δx) · (φᵢⁿ - φᵢ₋₁ⁿ)
The term u·Δt/Δx is the CFL number. Keeping it at or below 1 is the stability condition: if the fluid travels more than one cell width per time step, the scheme breaks down. That constraint on Δt is the practical price of the upwind approach.
The full cycle is: reconstruct the gradient, compute the flux, and integrate over the cell.
Numerical simulation
Key Question: What does a CFD run actually cost a team in time, accuracy, and turbulence resolution?
Speed: A single high-fidelity CFD run on a full-car geometry can take hours to days on a large compute cluster. Aerodynamicists can complete tens of simulations per week under budget, far fewer than the design space requires. Each configuration change restarts that clock.
Accuracy: Accuracy scales with mesh density. Refining the mesh to resolve features such as vortex shedding from front-wing endplates or wake interaction behind the rear diffuser increases the cell count and, therefore, the compute time nonlinearly. Teams constantly trade resolution against turnaround.
Turbulence: Turbulence is where traditional solvers carry their highest cost. Full Direct Numerical Simulation (DNS) is computationally prohibitive at race-relevant Reynolds numbers. In practice, teams rely on Reynolds-Averaged Navier-Stokes (RANS) or Large Eddy Simulation (LES) models, each of which introduces closure assumptions that limit fidelity in separated flow regions. The areas that matter most aerodynamically are precisely the ones most difficult to resolve.
What hardware is needed for F1 CFD?
Executing high-fidelity CFD simulations in motorsport demands specialized High-Performance Computing (HPC) architecture engineered to handle massive parallel-processing workloads and intensive data throughput. Because the FIA strictly regulates and caps total computational allocation (limiting both core-count utilization and maximum processing capacity per aerodynamic development cycle), Formula 1 teams must maximize the efficiency of every hardware cycle.
The cap is expressed in Mega Allocation Unit hours (MAUh), which the FIA derives from the number of processing unit cores used for a solver run, the peak clock frequency reached during it, and the wall-clock seconds elapsed. Only CPU cores count toward that formula today. The FIA has approved the use of GPUs for restricted CFD starting in 2028, a change that will require teams to rewrite their solver software to benefit from it.
Infrastructure Evolution: Modern setups have transitioned away from purely legacy on-premises clusters toward hybrid and cloud-native topologies.
Deployment Platforms: Highly optimized containerized workloads now run on platforms such as AWS HPC or Microsoft Azure alongside dedicated local nodes.
A standard motorsport HPC ecosystem relies on several tightly integrated layers:
Compute Nodes: Dense clusters utilizing thousands of high-frequency processor cores linked via ultra-low-latency interconnects (such as InfiniBand) to facilitate rapid inter-node communication during large-scale parallel scaling.
Workload Management: Advanced enterprise cluster management and job scheduling software such as Slurm or PBS Professional to optimize resource queues.
High-Throughput Storage: Parallel file systems and network-attached storage architectures capable of handling extreme read/write speeds concurrently, as a single transient simulation run can generate terabytes of raw data.
Post-Processing & Validation: Dedicated visualization nodes equipped with high-end enterprise GPUs to post-process and render volumetric flow fields, surface pressure maps, and vortex trajectories through advanced analysis software such as ParaView or Tecplot.
It is also worth noting that Formula One teams have very high security standards to protect their data and intellectual property. Therefore, they use specialized security software to protect their HPC, such as firewalls, intrusion detection systems, and VPNs.
Crucial role of front and rear wings
The rear wing's design is a critical aspect of Formula One aerodynamics, as it can significantly impact performance via rear downforce. Key aerodynamic components in F1 include the front and rear wings, the underfloor, and the diffuser.
The rear wing works by diverting airflow over the vehicle, creating a low-pressure area beneath it and a high-pressure area above it. The pressure differential between the two surfaces generates a downward force.
Under the 2026 regulations, the rear wing carries three elements, two of which move, and it is mounted on twin pylons. The assembly comprises the main plane, the endplates, and the movable flaps.
The main plane is the primary surface of the wing that generates most of the downforce.
The endplates are used to guide the airflow over the wing and control the pressure distribution.
The flaps rotate between a high-downforce corner mode and a low-drag straight-line mode, and their angles are adjusted to fine-tune the downforce-to-drag balance. The drag reduction system performed a narrower version of this function from 2011 to 2025, opening a single rear flap in designated zones and only for a car within one second of the car ahead. The 2026 active aerodynamics system removed that restriction, and every car can switch modes.
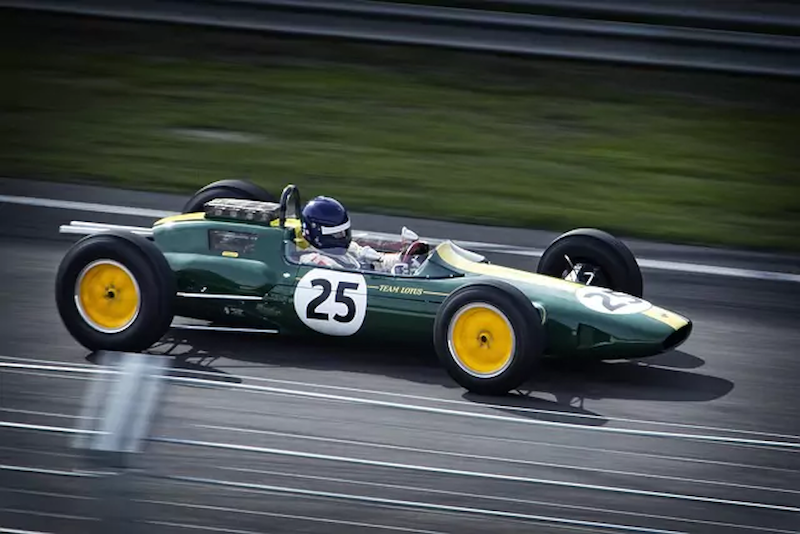
The rear beam wing (RBW) was an aerodynamic device mounted low across the rear of the car, above the rear suspension and parallel to the rear axle. It generated downforce and improved stability at high speeds by redirecting airflow over the rear of the car, creating a low-pressure area beneath it and a high-pressure area above it.
The 2026 regulations delete the beam wing from the permitted bodywork and replace it with a structural brace of minimal aerodynamic value. The load it carried now falls to the rear wing, the floor, and the diffuser.
The front wing is another key component that creates aerodynamic load. The front wing is located at the front of the car and is designed to create a downward force as the car moves through the air. The 2026 layout uses fewer elements to simplify the design, with a span 100 mm narrower than before and a two-element movable flap. This force presses the front tires into the track, increasing grip and traction for the driver and allowing them to take corners at higher speeds. Additionally, the downforce helps to improve stability. This makes it more difficult for a stable car to spin out of control.
The front wing works by diverting airflow over the car. It creates a low-pressure area on the top surface of the wing and a high-pressure area on the bottom surface. This creates a pressure difference between the wing's top and bottom surfaces, generating an aerodynamic load.
The 2026 bodywork rules also removed the winglets above the front wheels and returned simple in-wash bargeboards behind them. Both changes target the wake that the front wheels throw outward, which is the main obstacle to following another car closely.
Is the rear or the front wing more important?
The rear wing is more important for generating raw downforce. It is larger, produces a greater share of the car's total aerodynamic load, and offers more adjustability than the front wing, though both must work together for balance.
Both the rear and front wings are essential components of Formula One.
The downforce produced by the front wing is essential for providing traction to the front tires and allowing the driver to take corners at higher speeds.
The downforce generated by the rear wing is essential for providing traction to the rear tires and maintaining stability at high speeds.
Both the front and rear wings play critical roles in the car's performance. The front wing and the rear wing are, in fact, designed to work together, and the aerodynamic load produced by each wing is dependent on the other wing.
However, the rear wing is more critical for generating downforce (aerodynamic load) in Formula One. The rear wing is larger than the front wing and generates a greater proportion of the car's total aerodynamic load. Additionally, the rear wing is more adjustable than the front wing, which allows teams to fine-tune the car's aerodynamic performance. The rear wing is also subject to more regulations than the front wing regarding size, shape, and number of elements. Therefore, its engineering is even more challenging.
In the 1990s, front and rear wings dominated the aerodynamic load budget: the front wing contributed 40-50% and the rear wing 50-60%, with the floor playing a secondary role.
In the ground-effect era from 2022 to 2025, the floor and diffuser generated the largest share of the total aerodynamic load, while the front and rear wings each contributed a smaller share but remained critical for balance and trim.
The 2026 regulations end that era. With the Venturi tunnels gone and a partially flat floor in their place, load shifts back toward the wings, and the rear wing must deliver both corner-mode downforce and straight-mode drag reduction from a single rotating structure.
Method overview: from wind tunnel testing to AI
Computational Fluid Dynamics simulations are at the heart of the car development process for all Formula 1 teams and are among the critical performance factors in the race.
Even though teams can generate thousands of simulations annually corresponding to thousands of design variations, they are limited by both computational cost and FIA (International Automobile Federation) rules.
Among this large number of designs, it is critical to converge quickly towards optimized designs. Hence, running fast simulations is critical in this phase. However, low-fidelity simulations are not an option since the very complex nature of the phenomena can only be captured with high-fidelity resolution.
Engineering computations require a high degree of accuracy, as even the slightest improvement can affect aerodynamic performance. Also, simulations need complex mathematical operations over (hundreds of) millions of points in 3D space.
This can only happen with massive hardware, such as a CPU or GPU, with sufficient RAM and up to thousands of processors.
The regulatory ceiling
The FIA's Aerodynamic Testing Restrictions (ATR) dictate the total development volume each team may conduct per Aerodynamic Testing Period (ATP). There are six ATPs in a year, most of which are eight weeks long, so each is roughly a two-month allocation window. The framework operates on a sliding scale tied to a team's position in the Constructors' Championship. The team ranked seventh works to the baseline allocation of 320 wind tunnel runs and 2,000 CFD items per period.
The Allocation Balance: The lower a team finishes in the standings, the more testing capacity they are granted.
The Standings Delta: The constructor that finishes first is restricted to 70% of the baseline allocation, a midfield team ranked seventh receives 100%, and the team ranked tenth receives 115%. Every position on the grid adjusts the allowable compute and wind-tunnel allocations by 5%, and the table resets on 1 January and again at a mid-season cut-off.
The Penalty Matrix: Overruns are penalized. Exceeding a limit carries a reduction in subsequent ATP cycles of at least 10 times the amount by which the limit was exceeded.
The practical consequence of this sliding scale is a forced convergence of the grid: the teams with the fastest cars are legally restricted to the narrowest development windows. At the front of the field, the gap between what an aerodynamicist wants to simulate and what the regulations physically permit creates a permanent operational constraint.
Traditional AI approaches
In this section, we review a few traditional AI approaches.
Kriging is a method for predicting unknown values at a given point using the known values of nearby points. The prediction is based on a spatial correlation model. Kriging is commonly used in mining and all fields where spatial data are collected.
Gaussian process (GP) regression produces simplified models of complex systems. Aerodynamicists rely on them to approximate high-fidelity systems without incurring the cost of simulations. GP Regression, a non-parametric Bayesian method, fits smooth functions to sparse data by modeling the underlying function as a Gaussian process. Bayesian inference uses prior knowledge and data to estimate vehicle performance parameters. Although GP regressors provide predictions and uncertainty measures, they perform poorly with complex, non-linear 3D geometries of modern racing chassis. This limits their use, requiring simplified design variables, which modern geometric deep learning platforms aim to improve.
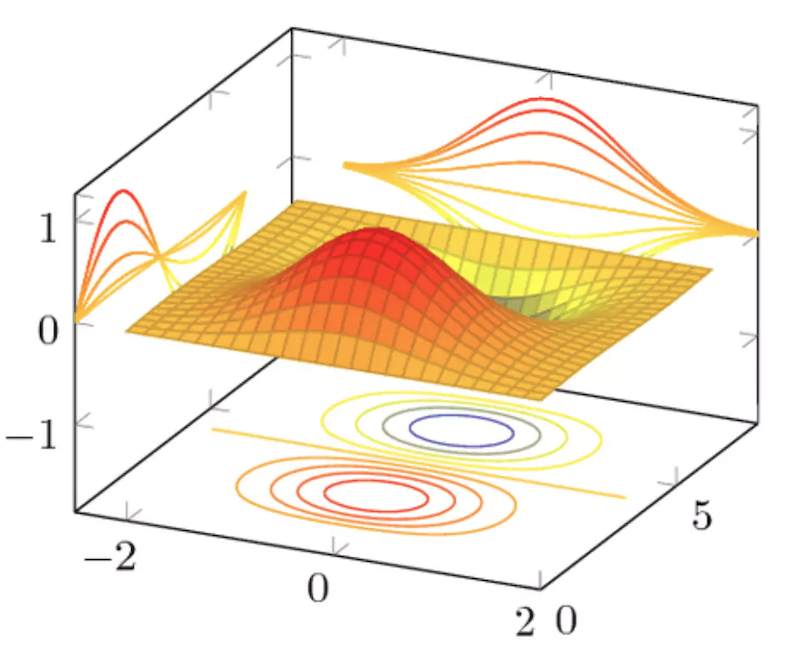
Reduced order modeling (ROM) encompasses a suite of mathematical techniques for constructing low-dimensional approximations of highly complex, high-fidelity systems. A ROM can reduce the computational overhead and clock time required to evaluate fluid dynamics by orders of magnitude. The high-dimensional 3D Computer-Aided Engineering (CAE) simulation data are projected onto a much smaller subspace.
Mathematical Foundations: A primary mechanism within this framework is Proper Orthogonal Decomposition (POD).
Dimensionality Reduction: POD extracts the most energetic orthogonal modes from a snapshot matrix of historical CFD runs. This allows engineers to capture the dominant features of a flow field using only a fraction of the original dataset's degrees of freedom.
While these traditional linear reduction methods successfully accelerate standard parametric sweeps, they fail to capture non-linearities in complex geometries. This limitation marks the boundary at which classical linear ROMs give way to nonlinear geometric deep learning architectures, which can map complex topological shifts without sacrificing localized flow accuracy.
Enter physics AI and Engineering Intelligence
The Neural Concept platform introduced Geometric Convolutional Neural Networks (GCNNs).
Unlike standard CNNs, which operate on regular 2D image grids, 3D GCNNs operate directly on 3D surface meshes. Convolution operations allow neural networks to learn aerodynamic patterns from the actual geometry rather than from pixelated projections.
As a result of the training process, the Physics AI engine can predict in fractions of a second (compared to hours needed by CFD).

Thus, physics AI speeds up individual simulations.
Accelerating a single simulation step, however impressive, doesn't change the shape of the engineering process. The improvement lies in the workflow structure. Rather than focusing on a single AI prediction in isolation, the improvement comes from supporting and documenting design decisions and allowing companies to own the intelligence that accumulates over months and across programs.
Thus, Engineering Intelligence changes what becomes possible to decide and who decides it, aligning F1 workflows with broader AI applications in engineering design and optimization.
The goal extends beyond a faster simulation engine to an intelligence layer that turns design exploration into a continuous, data-driven process.
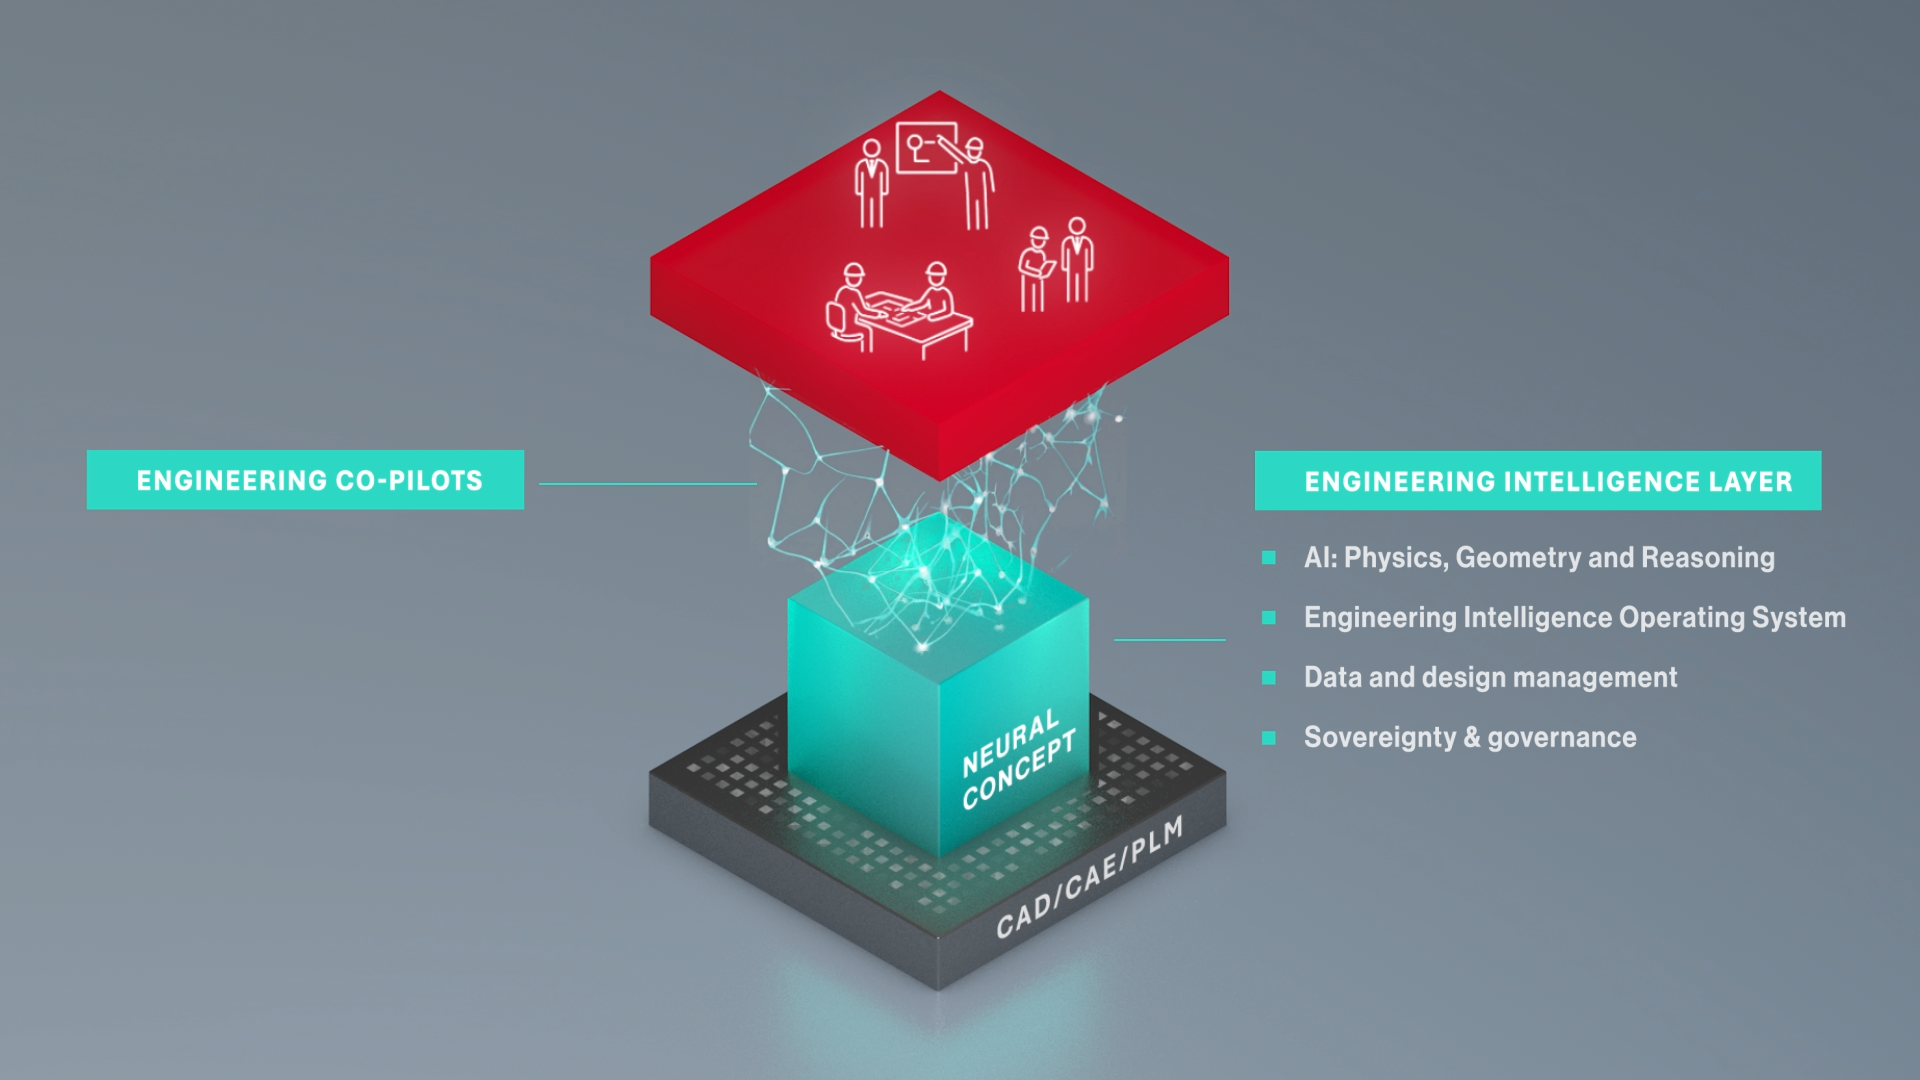
Neural Concept has built the intelligence layer for engineering on top of the physics-aware AI core, embedding aerodynamic predictions directly into design workflows and enabling engineers to explore entire design spaces rather than one geometry at a time. This is a concrete example of AI-enabled engineering product development at scale. In January 2026, the company added an AI Design Copilot that combines spatial reasoning, physics awareness, and CAD-ready geometry generation, so that a high-level design intent yields geometry that downstream CAD and CAE tools can edit.
Traditional approaches force a choice between accuracy and speed. Running enough simulations to map a design space meaningfully is either too slow or too expensive. Neural Concept's platform removes that constraint by connecting design-space generation to simulation-driven evaluation in a continuous loop. Over months and programs, the accumulated intelligence remains within the organization.
The DrivAerNet++ benchmark
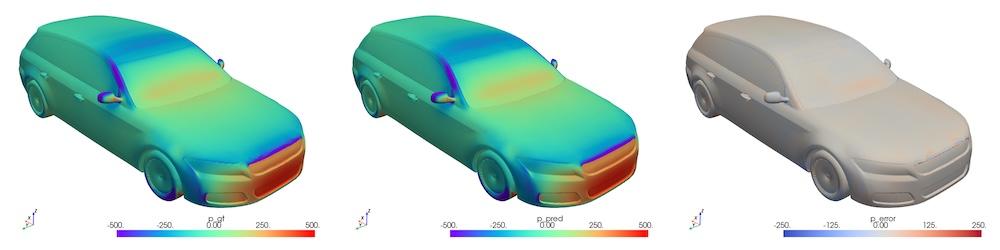
In 2025, Neural Concept achieved state-of-the-art results on MIT's DrivAerNet++, the most comprehensive public benchmark for automotive aerodynamic prediction.
The results cover all relevant external aerodynamic outputs: surface pressure, wall shear stress, volumetric velocity, and drag coefficient. On drag prediction, the Physics AI predictor reached an R² of 0.978 on the official test split against 0.957 for the previous best published method, reducing the mean squared error from 9.1e-5 to 0.8e-5, more than 10x lower. On the volumetric velocity field, it reduced the mean squared error by more than 50%. That level of accuracy supports early-stage design screening without running a full CFD simulation for every variant.
Training ran on four A100 GPUs and completed in 24 hours, with the best model reached after 16 hours; the resulting model serves real-time predictions on a single 16 GB GPU. Accuracy is where the benchmark ends and the engineering problem begins. Neural Concept turned 39 TB of raw CFD data, covering 8,000 car geometries, into a production-ready workflow in one week. Customers report 30% shorter design cycles and $20 million in savings on a 100,000-unit vehicle program.
DrivAerNet++ covers passenger car configurations: fastback, notchback, and estate back body styles, with ICE and EV underbody variants. The geometric complexity of fastback and estateback transitions presents wake-management challenges that are aerodynamically analogous to those motorsport engineers face behind diffusers and rear wings, making the benchmark a meaningful test of model generalization despite the difference in vehicle class.
Traditional CFD vs. AI-driven Engineering Intelligence: quick reference
Traditional CFD | Engineering Intelligence | |
|---|---|---|
Turnaround per design | Hours to days per run on HPC cluster | Seconds to minutes |
Prototype dependency | No physical prototype needed; geometry enters the queue directly from CAD | No physical prototype needed; geometry evaluated at inference time |
Repeatability | Identical boundary conditions every run; no tunnel calibration noise | Fully deterministic inference; results are as repeatable as the high-fidelity simulations used to validate the model |
CAD integration | Requires "clean" aerodynamic abstraction; design CAD must be manually prepared | Native geometric deep learning operates directly on CAD-native representations; integration with design workflows improves with each model generation |
Accuracy ceiling | High fidelity achievable with sufficient mesh refinement and LES/DNS | Validated against full CFD on production geometries; accuracy improves systematically as the training dataset grows |
Turbulence resolution | RANS/LES models available; DNS prohibitive at high Reynolds numbers | High-fidelity turbulence representation derived from training data; coverage extends as the dataset grows |
Skill requirement | Specialist CFD engineers required; significant expertise beyond software operation | Lower barrier for design-space exploration |
Infrastructure cost | Large HPC cluster; cost scales with run frequency | High upfront training cost; marginal inference cost near zero once deployed |
Design space coverage | Each configuration is a separate run; broad exploration is compute-limited | Thousands of configurations per session; exploration cost largely decoupled from run count |
F1 use case
The case study uses a synthetic dataset of 1,000+ unique front-end geometries, each parametrized across several shape variables and simulated at race speed. In real-world new cars, designers are also constrained by new regs beyond pure aero targets. The 2026 rules cut the minimum weight from 800 kg to 768 kg, shortened the maximum wheelbase from 3,600 mm to 3,400 mm, and narrowed the car from 2,000 mm to 1,900 mm, each of which changes packaging and aero trade-offs. F1 teams must also pass stringent homologation tests for safety, several of which became more severe for 2026, including a roll hoop load raised from 16g to 20g and a two-stage front impact structure. The geometry covers the front wing assembly, nose, and bargeboard region, chosen to stress exactly the capabilities where ROM fails: long-range aerodynamic correlations, complex vortex structures, and multiple connected components.
The geometry family predates the 2022 rules, and the bargeboard region it covers was removed that year. Simple in-washing bargeboards return behind the front wheels in 2026. The method itself is independent of any given regulation cycle, because the network learns from surface geometry rather than from a fixed parameter list.
Generative CAD design
In this case, we did not utilize the source F1 data from a real F1 team for obvious confidentiality reasons. We resorted to dataset synthesis.
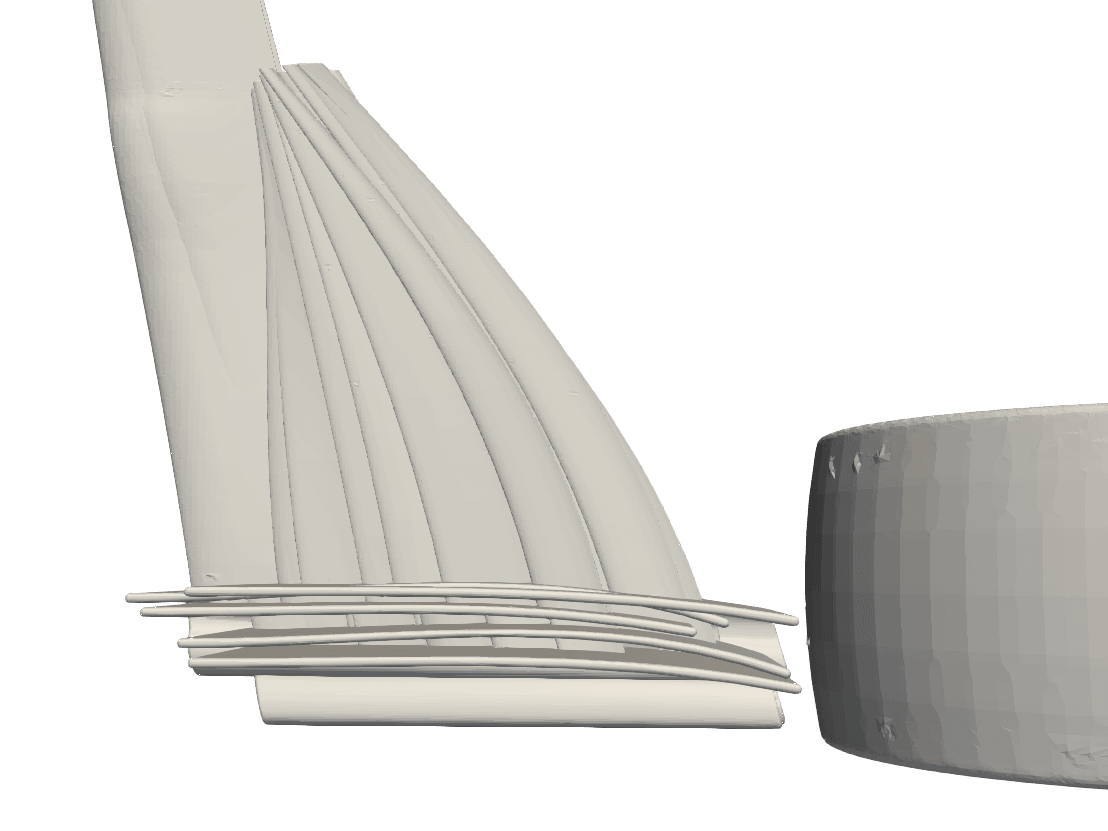
Dataset synthesis generates new data samples similar to existing ones but with variations. This can be done by simulating the underlying processes that generated the original data. The goal of dataset synthesis is to increase the size and diversity of a dataset to train a neural network, or even to create a brand-new dataset, as in our case. Onshape CAD was used to design the car geometry by varying up to 56 different variables, as detailed in the figures (parameter descriptions).

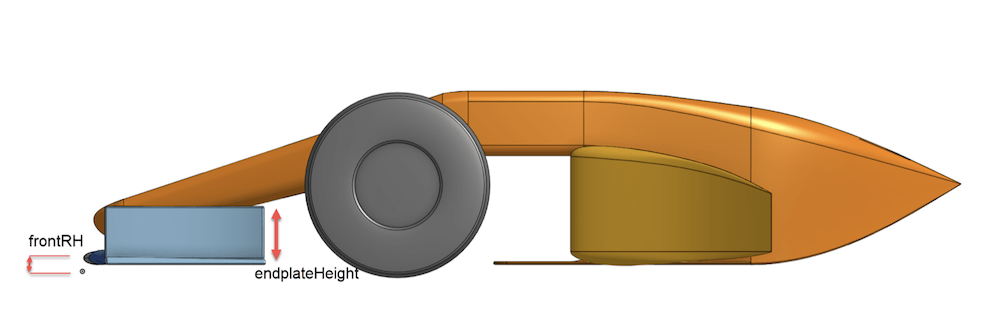
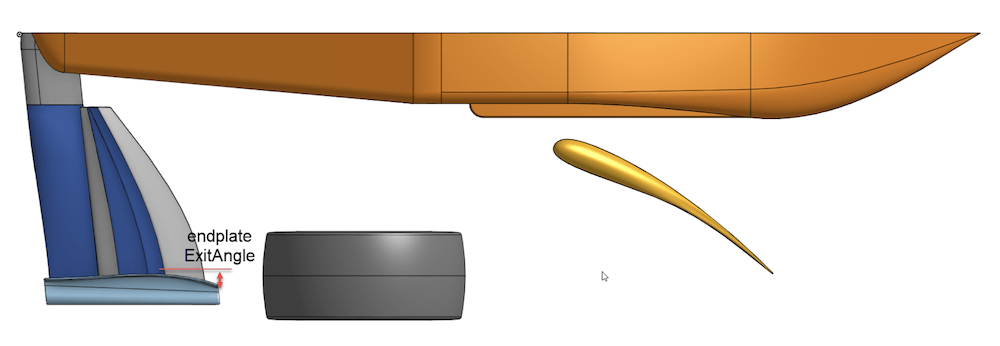
This allowed performing fine design variations on the car. Defining lower and upper bounds for each shape parameter, a random value was chosen at each iteration. Thus, we built a database of 1644 geometries, ensuring a good distribution, with each geometry unique in the dataset.
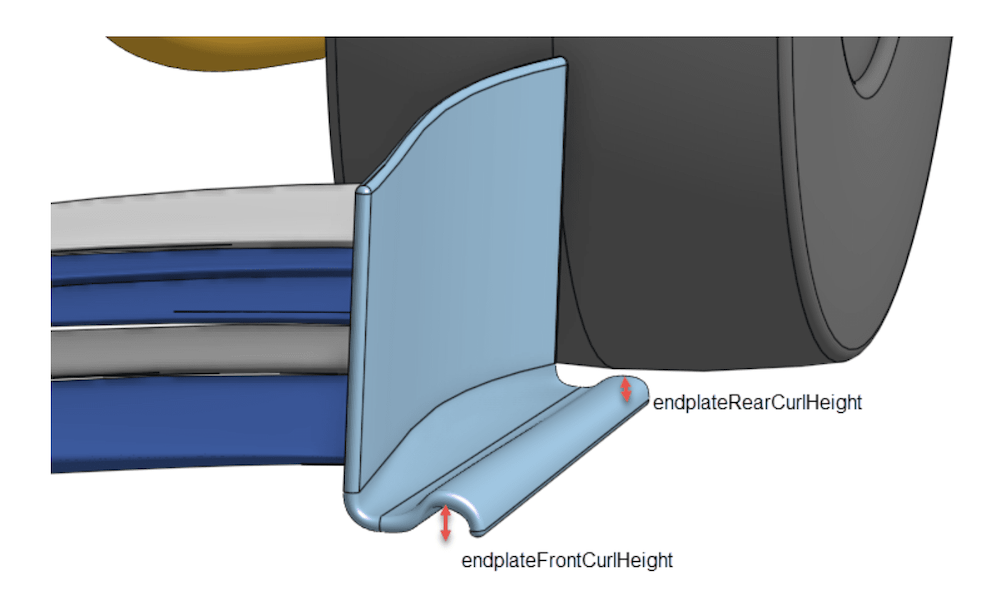
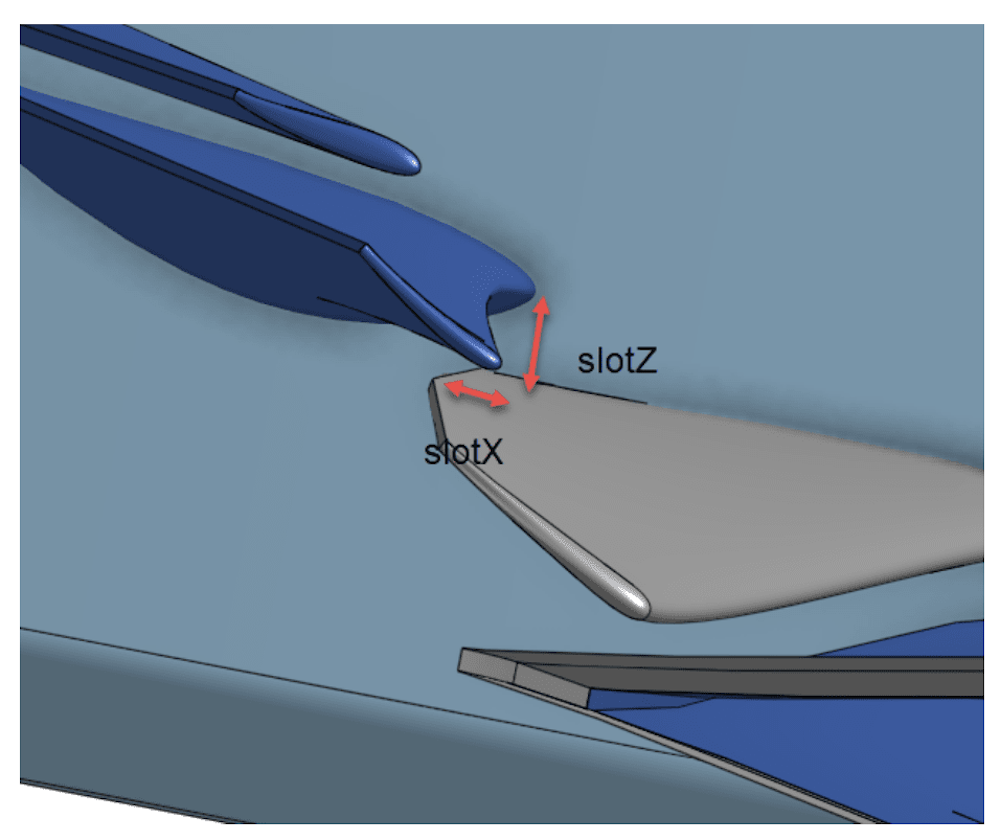
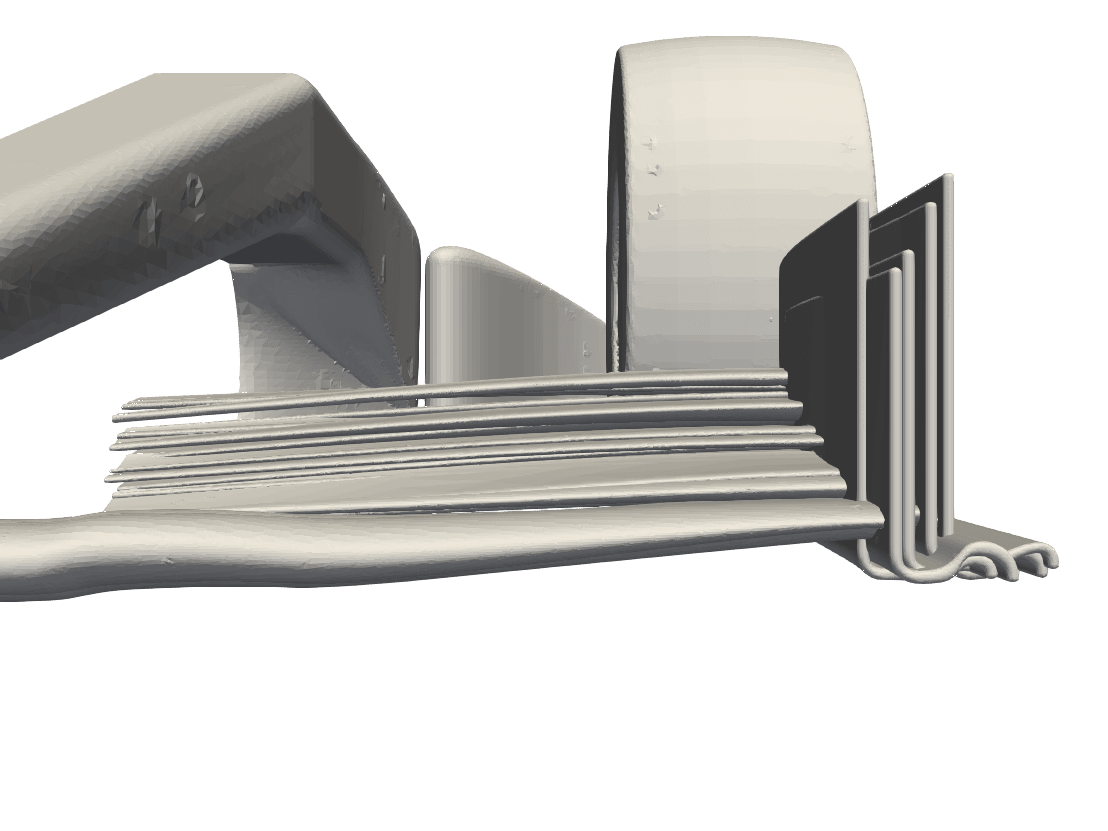
Onshape geometries were exported as STL (Stereolithography) files. This CAD format reflects a more realistic, non-parametric nature and illustrates the difficulties that Neural Concept can easily overcome, whereas ROM cannot.
Numerical simulation
OpenFOAM was used for CFD simulations at a velocity of 250 km/h (70 m/s) in the absence of crosswind. We used half of the car (symmetry). The tire was defined as rotating at the car's speed. The shape and wake of the front wheels are major aerodynamic considerations because they generate turbulence.
It was essential to account for turbulence modeling.
Turbulence affects car aerodynamics: flow can form vortices and other structures that disrupt the airflow over the wings and other aerodynamic surfaces, diminishing their effectiveness and making it harder for the driver to control the car. Teams have also historically used outwash around the front tire to push disturbed flow away from the car body and create smoother air downstream. That wake behavior also affects the following car, so controlling it matters in close racing. The 2026 regulations work against outwash directly, mandating simpler front wings and in-wash bargeboards.
The turbulence model used was the SST k-ω transport model: it uses two equations to describe turbulent fluid flow and is a Reynolds-Averaged Navier-Stokes (RANS) model. It is widely used for predicting flow features in complex geometries, such as those encountered in F1.
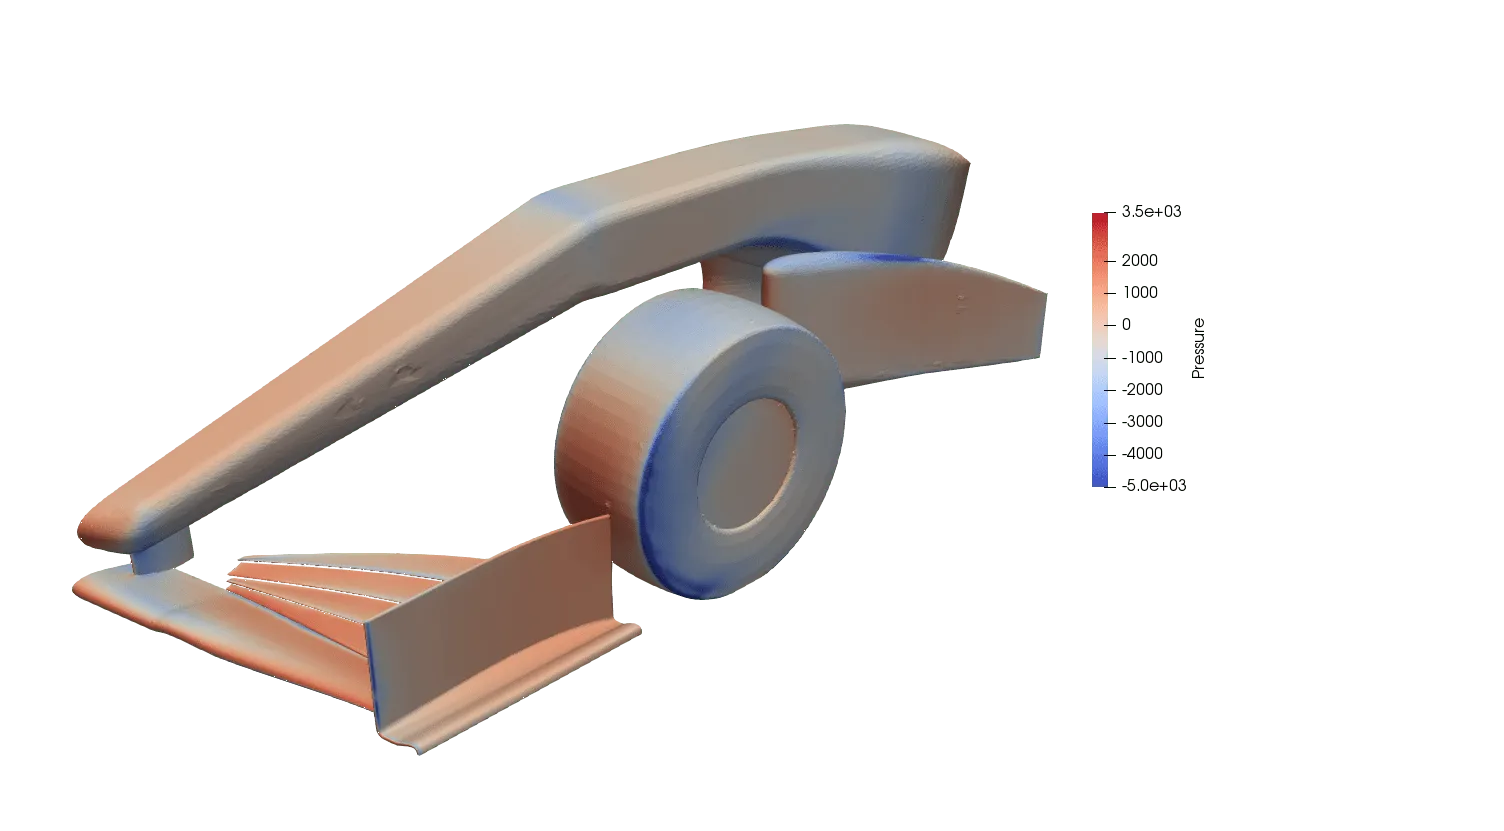
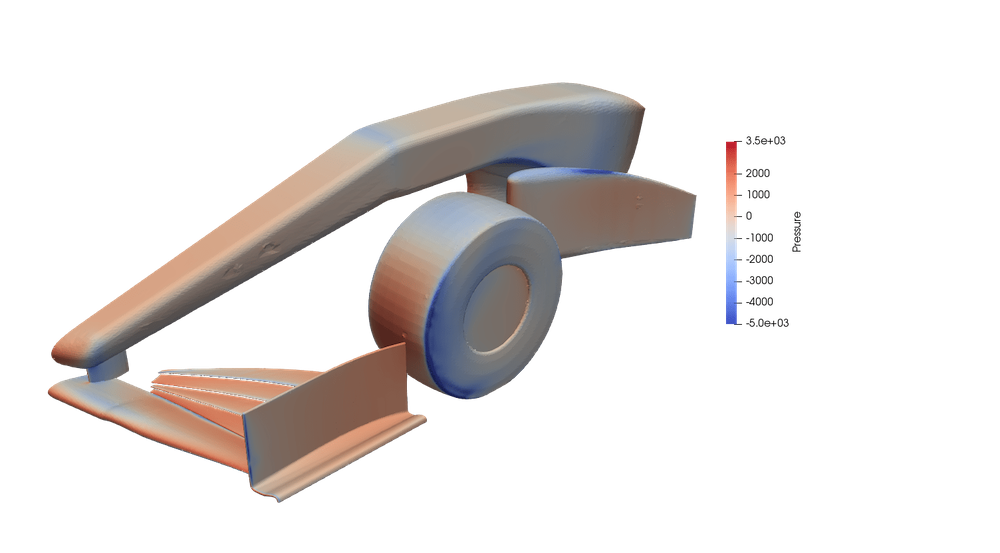
Simulation post-processing was extracted on the car's surface, as shown in the figure.
The flow field has also been visualized on a plane slice taken at the last iteration, at 1.7 m, i.e., just behind the tire. These data were used to train the deep neural network. Indeed, taking the full 3D volumetric prediction is too expensive. Using plane slices is an excellent trade-off and allows us to assess the influence of slight geometric variations more precisely. This vertical-plane slice also allows us to observe critical flow phenomena along the car that aerodynamicists wish to control. A visual example is given in the figure.
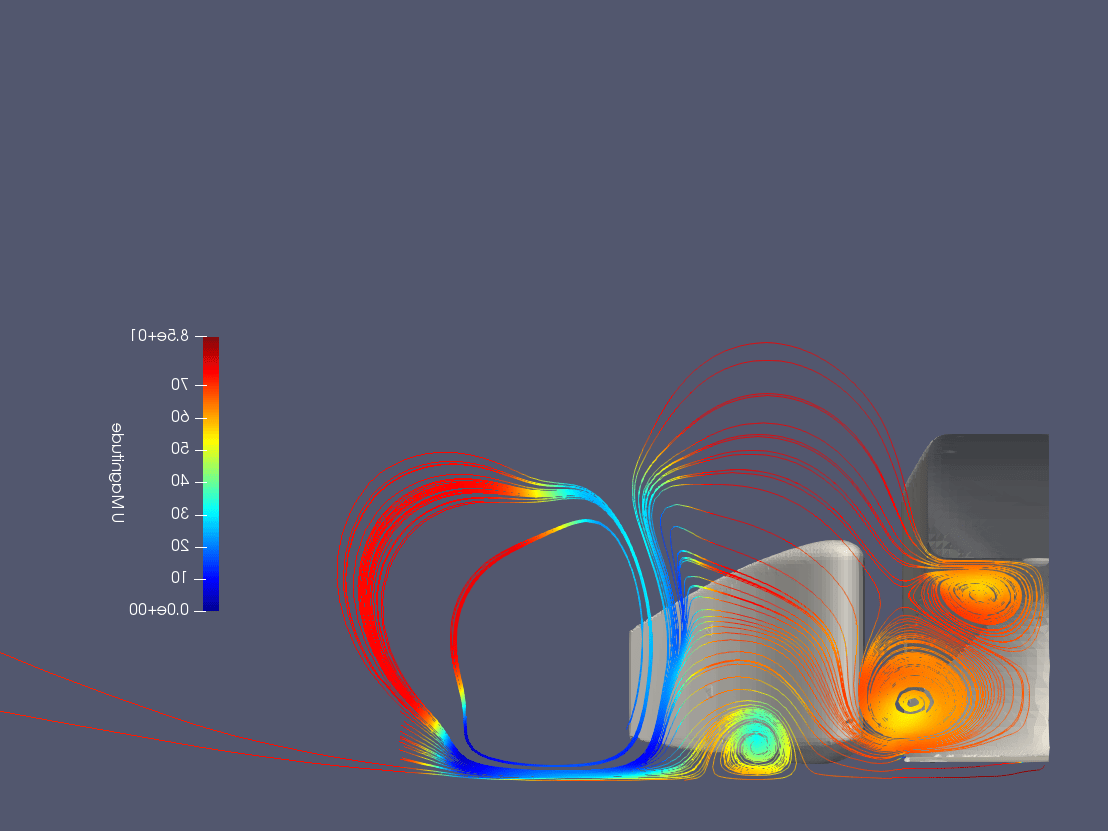
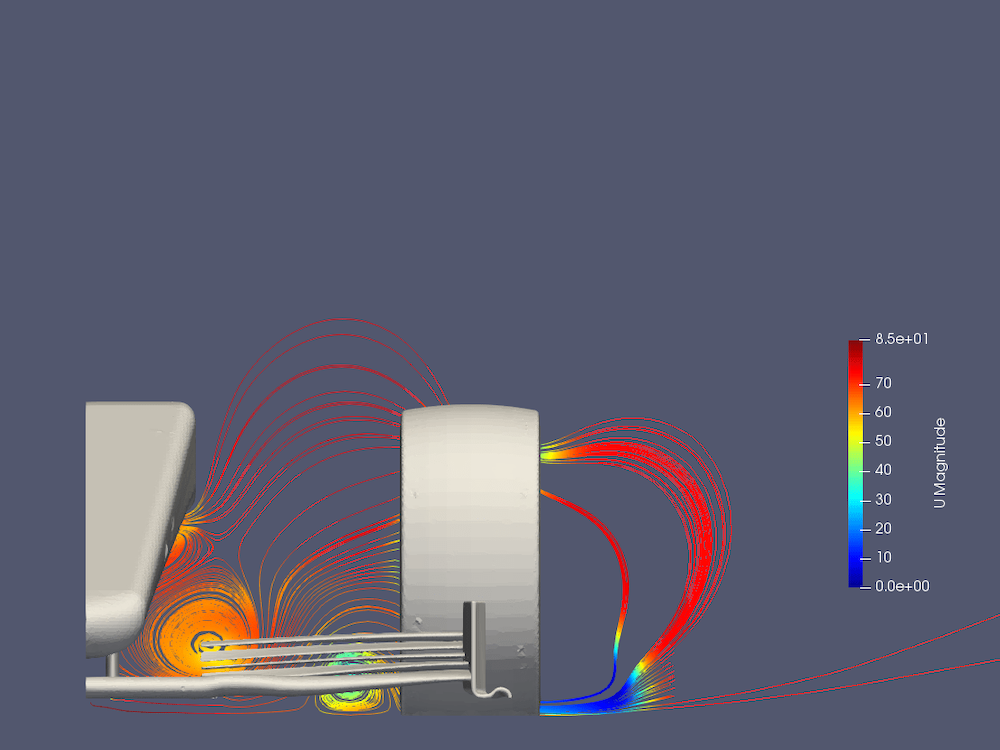
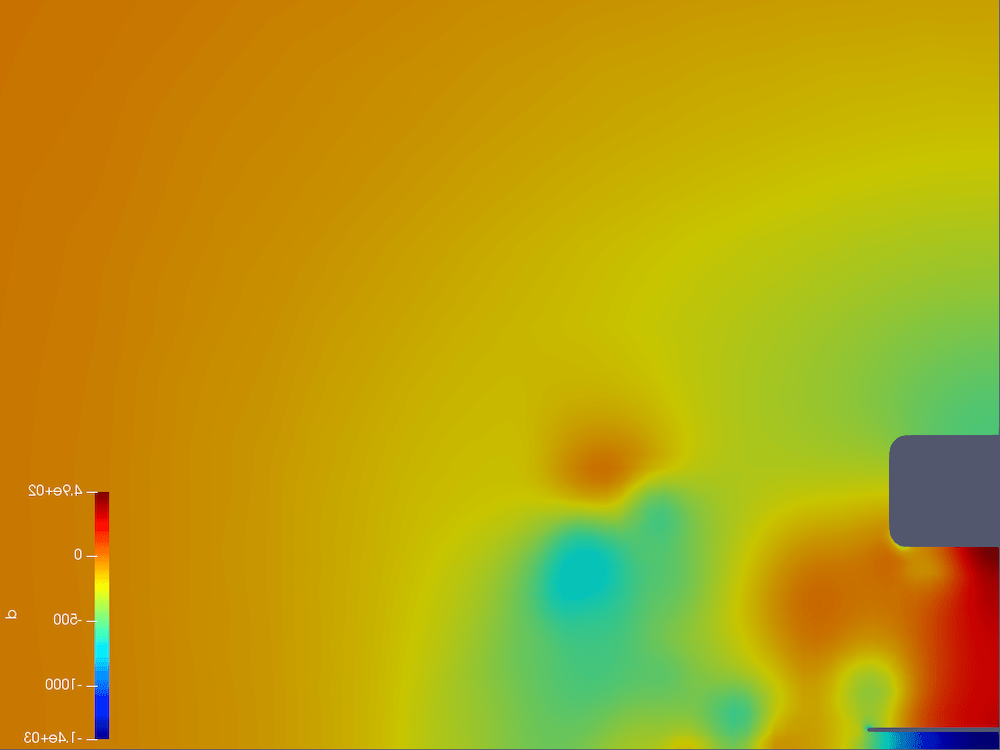
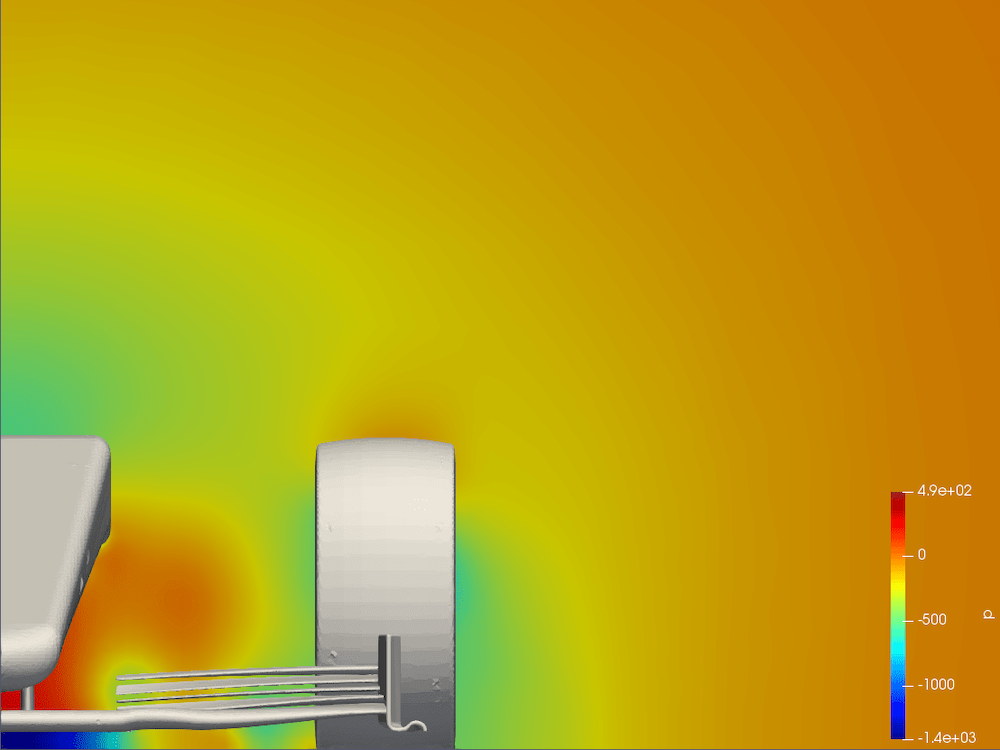
The vertical plane is just behind the tire, where vortices are present.
Neural network architecture
The deployment of Geometric Deep Learning in aerodynamic optimization relies on specialized neural network architectures designed to process non-Euclidean data, such as complex 3D vehicle meshes. Instead of relying on traditional pixel-based or voxel-based convolutions, the network utilizes surface-oriented geodesic convolutions to analyze fluid dynamics directly on the car's geometry.
The structural pipeline of the network consists of two distinct operational branches:
The Global Feature Branch: The first branch pre-processes the raw 3D mesh input, utilizing a sequence of geodesic convolutions to extract surface feature maps. These localized features are then passed through an average pooling layer and two fully connected (dense) layers to predict global scalar values, such as total aerodynamic load, total drag, and aerodynamic balance coefficients.
The Local Field Branch: The second branch simultaneously processes the geometry to generate highly detailed local surface distributions, such as continuous pressure and velocity fields. This branch combines additional geodesic convolutions with pointwise operations to map localized fluid behavior across the chassis bodywork, leveraging GPU acceleration to perform complex geometric tensor operations in real time.
A core advantage of this neural network architecture is that it remains completely agnostic to underlying geometric parameterization. The network does not require a rigid, predefined set of CAD variables (such as specific wing angles or flap lengths) to calculate a prediction.
Instead, it evaluates performance based purely on the spatial topologies and surface shapes it learned during training. This allows aerodynamicists to feed completely radical, unparameterized design concepts into the model and receive accurate pressure field inferences instantly, bypassing the hours of manual CAD setup traditionally required for CFD meshing.
Neural network performance
The coefficient of determination, R², measures the proportion of variance in the dependent variable explained by the independent variables in a regression model. It compares this to a simple mean predictor.
R² = 0: The model performs no better than a baseline horizontal line representing the mean of the dataset, explaining none of the underlying variance.
R² = 1: The model achieves a perfect fit, explaining 100% of the variance with zero residual error across the data points.
In deep learning, the R² score is a key validation metric for assessing a neural network's fit.
A high training R² indicates good optimization, but engineers also monitor validation and test R² to confirm that the model generalizes well to unseen geometries. A high out-of-sample R² indicates that the neural network captures the system's physics rather than just memorizing the training data.
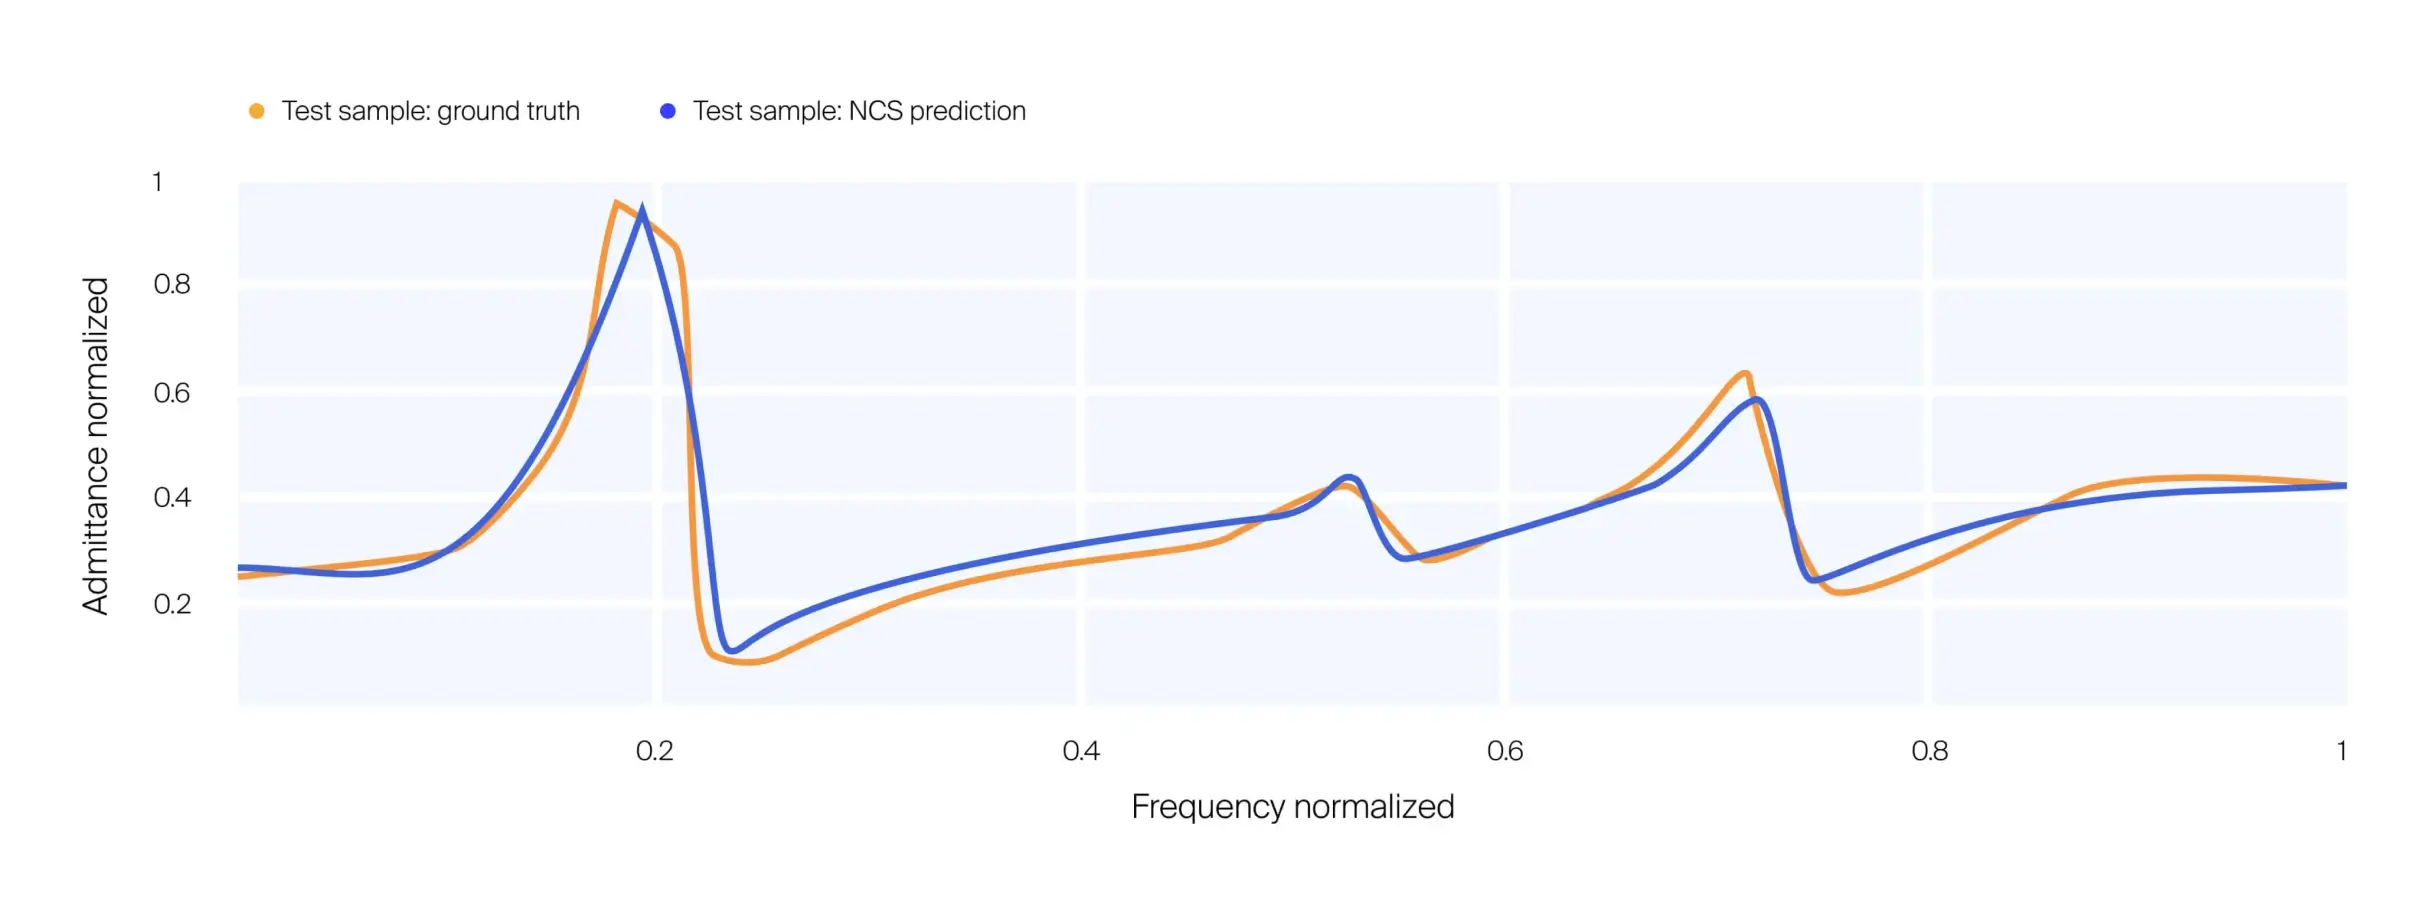
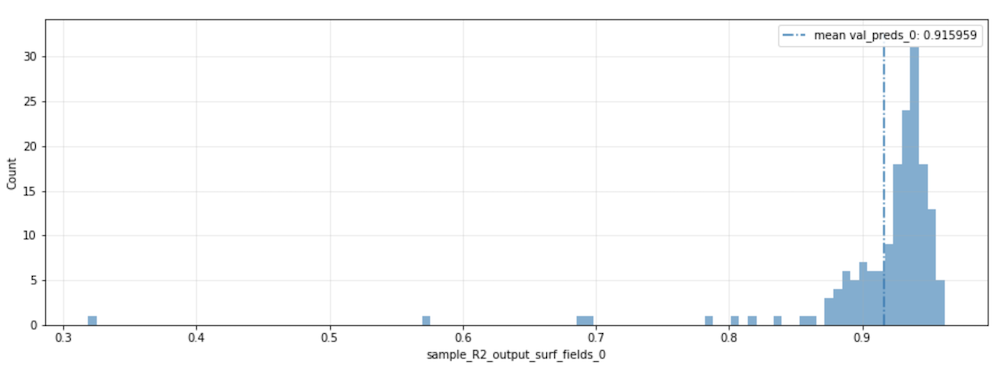
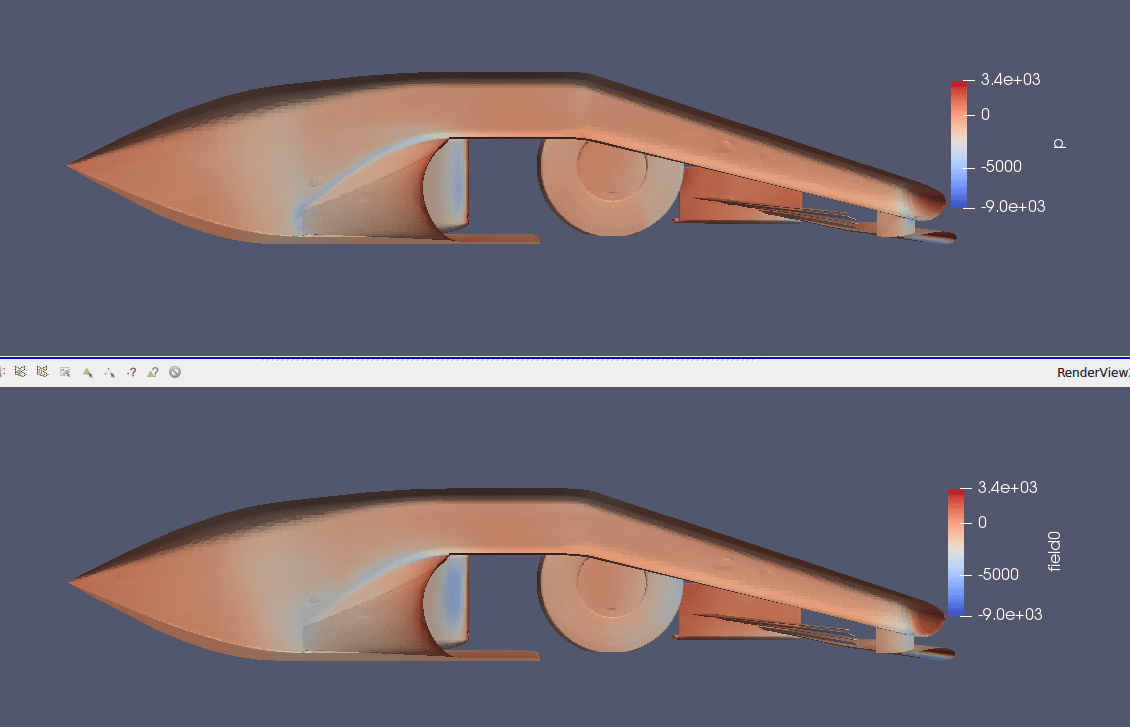
We first predicted the flow over the car surface and evaluated aerodynamic performance. The surface pressure prediction was robust, with an all-point-mixed R² of 0.916. The distribution of R² scores and a CFD-versus-AI comparison are shown below.
Next, we predicted pressure on the vertical plane behind the tire, capturing key vortex structures. The R² was 0.967, with detailed R² distribution and comparisons in the Appendix.
Implementation
Neural Concept operates above CAD and PLM (Product Lifecycle Management), providing engineers with an Engineering Intelligence layer for design exploration and decision-making.
The platform supports two distinct roles.
Building: AI and methods engineers configure the environment: defining parametric design spaces, connecting simulation tools, and building focused interfaces for specific programs.
Operating: Aerodynamicists and performance engineers then run those workflows directly through a design copilot that reports performance as the geometry changes. They explore options, evaluate trade-offs, and make decisions without needing to access the underlying automation layer.
This separation matters in competitive environments. Engineers with deep domain knowledge can operate AI-native workflows without ML expertise, while IP-sensitive configurations stay controlled at the platform level. Deployment is available in the cloud or on-premises.
F1 use case - conclusion
The model delivers aerodynamic predictions in under 0.1 seconds, against hours for a full CFD run. At that speed, an engineer who previously ran five simulations a week can now run hundreds. The design space stops being a sample and becomes a searchable asset.
This enables a different model of aerodynamic engineering. Design decisions are no longer ratified by the single simulation that fits within a deadline. The space around each decision becomes navigable, with thousands of configurations assessed and retained as organizational knowledge rather than archived as project records.
Here, the cumulative design advantages begin to emerge. F1 teams that treat legacy CFD data as training assets accumulate proprietary intelligence, owned by their organization. Results grow more precise with every design cycle.
Neural Concept's platform was conceived to support this journey from scattered predictions to an intelligence layer embedded in the workflow, evolving with each program.
The intelligence layer is already in production, supporting programs at more than 70 OEMs and Tier 1 suppliers, including General Motors, Airbus, and the VCARB Formula 1 team. Passenger car aerodynamics operates at different speeds and scales than F1, but every engineering organization faces the same fundamental scarcity: too many possible designs, too little time to evaluate them. Neural Concept was built to solve exactly that.
Ready to explore a design space instead of sampling it?
Explore the platform →FAQ
How does the F1 Drag Reduction System (DRS) work?
DRS opened a flap in the rear wing to reduce drag on straights. It ran from 2011 to 2025, was available only to a car within one second of the car ahead at a detection point, and only in designated zones. The 2026 regulations removed it. Active aerodynamics now moves both the front and rear wings between corner and straight modes, and every car can use the system. Overtaking assistance moved to an energy boost of up to 0.5 MJ from the MGU-K, available to a driver within one second of the car ahead.
How does "dirty air" from a leading car affect overtaking opportunities in F1?
Dirty air reduces the following car's front-wing performance, costing it aerodynamic load and grip in corners and preventing it from staying close enough to attack under braking. On straights, the same wake works in the opposite direction, reducing drag and helping the chasing car close up. The 2026 rules address the problem with simpler front wings and in-wash bargeboards that keep the front-wheel wake closer to the car.
What's the difference between F1 aerodynamics and road car aerodynamics?
F1 aerodynamics maximize downforce for a given drag penalty, while road car aerodynamics minimize drag for fuel consumption or electric range. An F1 car therefore carries high-drag appendages that no production vehicle would accept. The operating conditions differ as well: an F1 car operates in close proximity to the ground with exposed rotating wheels, and its bodywork changes between circuits, whereas a production car's bodywork is fixed for the life of the program.
How does F1 aerodynamics differ from IndyCar aerodynamics?
IndyCar is a spec series. Every entry uses the same Dallara chassis with the universal aero kit introduced in 2018, and teams cannot develop their own bodywork. They select between road and street, short oval, and superspeedway configurations, then work on setup. F1 teams design their own bodywork within the FIA's aerodynamic testing restrictions, making in-house CFD and wind-tunnel capabilities a competitive asset. A new Dallara IR-28 chassis is scheduled for the 2028 IndyCar season.
What causes porpoising in ground-effect F1 cars, and how do teams solve it?
Porpoising occurs when the underfloor stalls at low ride height, loses suction, allows the car to rise, then reattaches and pulls it down again, setting up a vertical oscillation. Teams addressed it by raising ride height, revising floor edge geometry, and stiffening the platform. The FIA issued technical directive 39/22, which introduced an aerodynamic oscillation metric measured by a mandatory accelerometer, and then raised the floor edge and the diffuser throat for 2023. The 2026 cars remove the Venturi tunnels entirely, which removes the mechanism that produced the effect.
Why were complex bargeboards banned in the 2022 F1 aero regulation overhaul?
They were removed because they generated outwash. The vanes pushed the front-wheel wake sideways into a large turbulent structure that a following car could not drive through, thereby suppressing overtaking. The 2022 rules deleted them and moved downforce generation to the floor. Simple in-washing bargeboards return behind the front wheels in 2026, this time shaped to hold the wake close to the car rather than throw it outward.
How do teams balance downforce vs. drag setups for different circuits (e.g., Monza vs. Monaco)?
Teams change wing angle and wing specification to match the ratio of straight-line running to cornering. Monza rewards a low-drag package that sacrifices cornering load, while Monaco rewards maximum downforce because top speed matters little. Under the 2026 rules, straight mode cuts drag on the straights, so a team can carry a higher corner-mode wing angle than the previous regulations allowed without paying the same penalty on the straights.
What is aeroelasticity ("flexi-wings"), and why is it controversial in F1?
Aeroelasticity is the deflection of a wing under aerodynamic load. A wing that passes a static test in the garage can bend at speed into a lower-drag position, which delivers a benefit the regulations do not intend to permit. The FIA polices it with static load-deflection tests, which it tightened during 2025 for rear wings from the opening round and for front wings from the Spanish Grand Prix. For 2026, the tests also cover the rotation mechanisms of the movable wings, and they apply to the static structure and the mechanism separately.
Sources
Fédération Internationale de l'Automobile, FIA Formula One World Championship — Technical, Sporting and Operational Regulations, 2026: the source for the Aerodynamic Testing Restrictions, the chassis dimensions and the power unit rules cited here. Published on fia.com.
Formula 1, Explained: unpicking the 2026 aerodynamic regulations — the movable-wing modes, the reduction in downforce and drag, and the revised dimensions.
Neural Concept, From dataset to design impact: a new benchmark on MIT's DrivAerNet++ — the R², mean squared error, training setup and dataset figures quoted above.
Mohamed Elrefaie et al., DrivAerNet++: A Large-Scale Multimodal Car Dataset with Computational Fluid Dynamics Simulations and Deep Learning Benchmarks, MIT, 2024. arXiv:2406.09624.
OpenFOAM — the open-source CFD toolbox used for the simulations in the use case.
F. R. Menter, Two-equation eddy-viscosity turbulence models for engineering applications, AIAA Journal, 1994 — the SST k-ω model applied here.
Appendix — abbreviations
ATR — Aerodynamic Testing Restrictions; ATP — Aerodynamic Testing Period
MAUh — Mega Allocation Unit hours, the FIA's unit for capping CFD use
CFD — computational fluid dynamics; HPC — high-performance computing
RANS — Reynolds-Averaged Navier-Stokes; LES — Large Eddy Simulation; DNS — Direct Numerical Simulation
SST k-ω — the shear stress transport two-equation turbulence model
GCNN — geometric convolutional neural network, convolution on a 3D surface mesh
ROM — reduced order model; POD — proper orthogonal decomposition
GP — Gaussian process regression
R² — coefficient of determination, the share of variance the model explains
DRS — drag reduction system, in force from 2011 to 2025
MGU-K — motor generator unit, kinetic; rated at 350 kW under the 2026 power unit rules
RBW — rear beam wing, deleted for 2026
STL — stereolithography, the triangulated surface format exported from CAD