A Novel Approach to Turbulence Model Development using Neural Concept


The most significant challenge in applied fluid mechanics is the limited understanding, and therefore limited prediction capability, of turbulence dependent features. This reduces industrial confidence in CFD for aeronautical applications such as flow detachment over an aircraft wing and shock boundary layer interactions. Against this background, the HiFi TURB project, coordinated by NUMECA, is addressing key deficiencies in turbulence modelling.
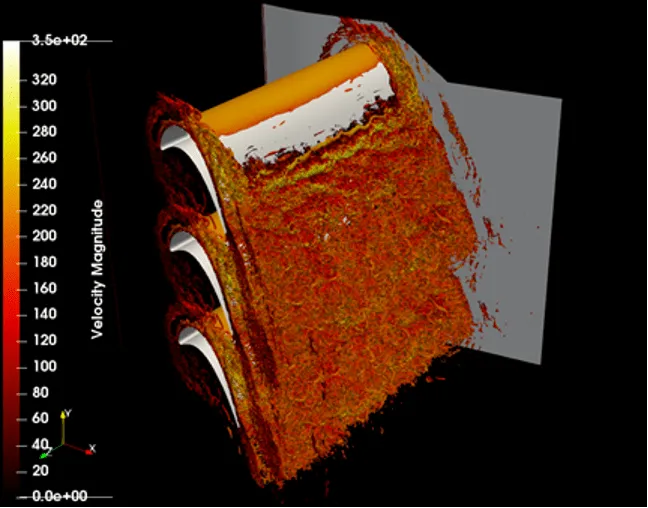
The large scale availability of High-Performance Computing (HPC) opens the door to a truly novel approach to turbulence model development. Exploiting Artificial Intelligence (AI) and Machine Learning (ML) techniques applied to a database of high-fidelity, scale-resolving simulations of test cases that contain most features of separated flow regions or complex 3D flows. Figure 1 shows an example of a flow field that is used as the basis for the turbulence modelling task.
The volume of data produced by these simulations requires a different approach to extracting insight. Neural Concept supports this work by enabling deep learning workflows that help teams analyze very large 3D simulation datasets and uncover patterns that are difficult to detect with conventional post processing alone.
Using Neural Concept’s geometry based Variational Auto Encoders (VAE), NUMECA gained first insights into correlations across tens of statistically averaged flow variables. The VAE compresses high-dimensional simulation data into physically meaningful embeddings and reconstructs the original inputs with high accuracy. This makes it possible to explore and analyze complex flow behavior faster and more interactively, while preserving the link back to the underlying physics.
The outcome is easier handling of large simulation datasets, and new ways to apply data mining and statistical analysis techniques to improve understanding of the physics contained in the data.
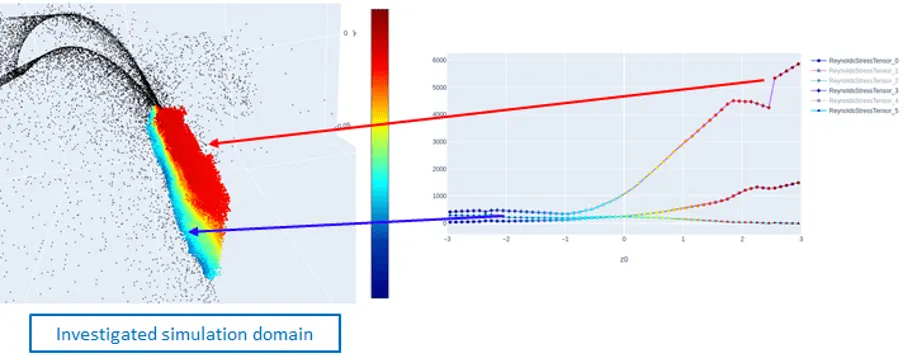
Figure 2 shows an example of the possible analysis. The colors of the symbols on the 2D plot correspond to the value of the ‘embedding’ and are the same in the 3D view (left) and in the 2D plot (right). Points of the same color have the same value for all the considered physical quantities and the 3D view colored by the embedding value, gives us one global statistical representation for several physical quantities over the investigated domain. Both plots together provide a new perspective on the flow behavior via the machine learning model. Figure 2, shows snapshots of the views used in the Graphical User Interface.
.webp)
.webp)